Immigrants from India vs Sri Lankan Poverty
COMPARE
Immigrants from India
Sri Lankan
Poverty
Poverty Comparison
Immigrants from India
Sri Lankans
9.0%
POVERTY
100.0/ 100
METRIC RATING
1st/ 347
METRIC RANK
11.7%
POVERTY
89.4/ 100
METRIC RATING
117th/ 347
METRIC RANK
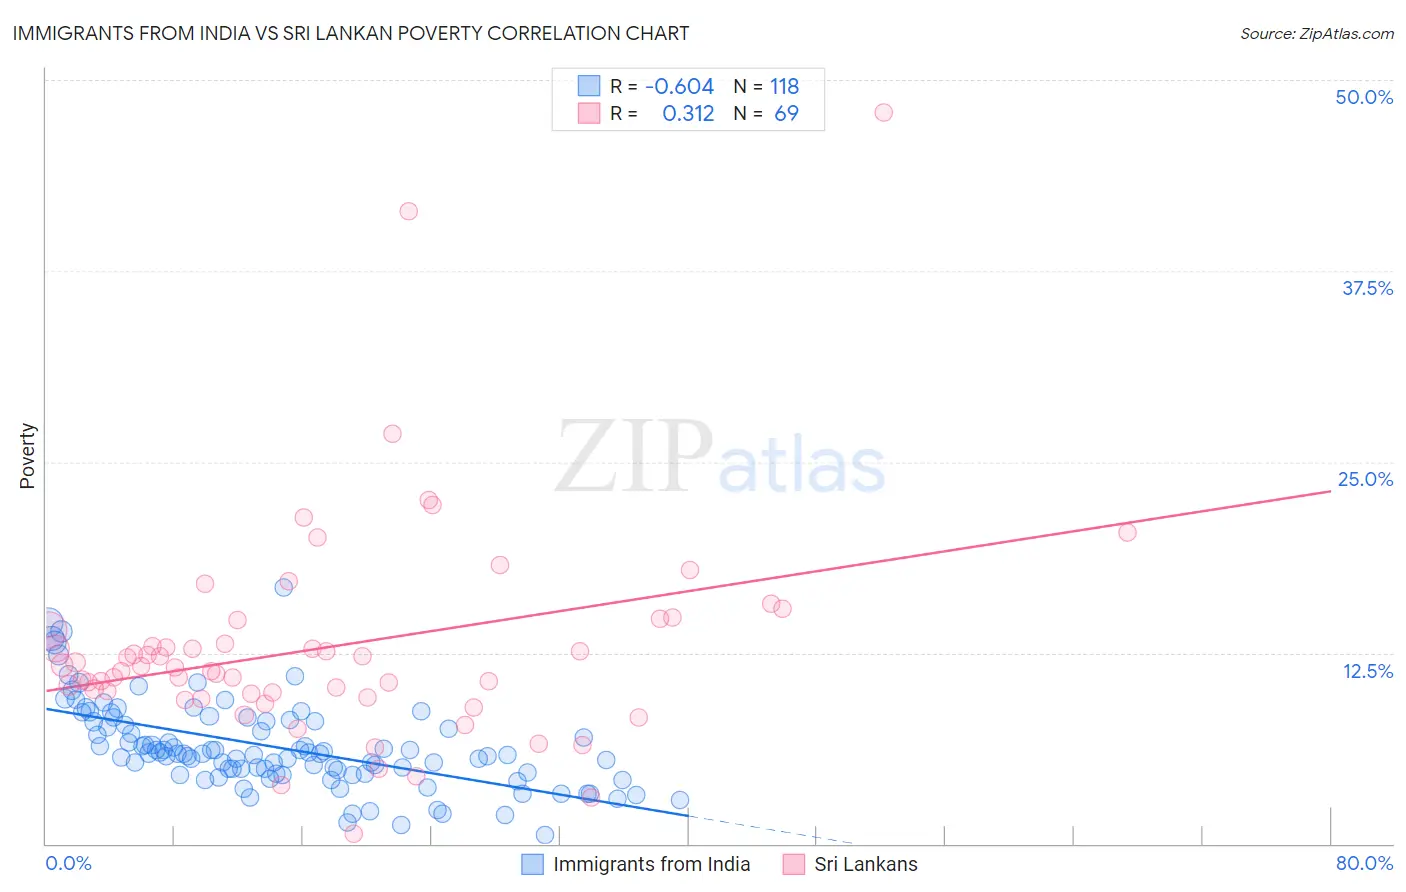
Immigrants from India vs Sri Lankan Poverty Correlation Chart
The statistical analysis conducted on geographies consisting of 433,739,641 people shows a significant negative correlation between the proportion of Immigrants from India and poverty level in the United States with a correlation coefficient (R) of -0.604 and weighted average of 9.0%. Similarly, the statistical analysis conducted on geographies consisting of 440,138,450 people shows a mild positive correlation between the proportion of Sri Lankans and poverty level in the United States with a correlation coefficient (R) of 0.312 and weighted average of 11.7%, a difference of 29.3%.
Poverty Correlation Summary
| Measurement | Immigrants from India | Sri Lankan |
| Minimum | 0.59% | 0.64% |
| Maximum | 16.8% | 47.9% |
| Range | 16.2% | 47.2% |
| Mean | 6.3% | 12.9% |
| Median | 5.9% | 11.5% |
| Interquartile 25% (IQ1) | 4.6% | 9.7% |
| Interquartile 75% (IQ3) | 8.0% | 14.3% |
| Interquartile Range (IQR) | 3.4% | 4.6% |
| Standard Deviation (Sample) | 2.8% | 7.2% |
| Standard Deviation (Population) | 2.8% | 7.2% |
Similar Demographics by Poverty
Demographics Similar to Immigrants from India by Poverty
In terms of poverty, the demographic groups most similar to Immigrants from India are Chinese (9.5%, a difference of 5.6%), Thai (9.6%, a difference of 6.1%), Immigrants from Taiwan (9.7%, a difference of 7.6%), Immigrants from Ireland (10.1%, a difference of 11.6%), and Assyrian/Chaldean/Syriac (10.1%, a difference of 11.8%).
| Demographics | Rating | Rank | Poverty |
| Immigrants | India | 100.0 /100 | #1 | Exceptional 9.0% |
| Chinese | 100.0 /100 | #2 | Exceptional 9.5% |
| Thais | 100.0 /100 | #3 | Exceptional 9.6% |
| Immigrants | Taiwan | 100.0 /100 | #4 | Exceptional 9.7% |
| Immigrants | Ireland | 99.9 /100 | #5 | Exceptional 10.1% |
| Assyrians/Chaldeans/Syriacs | 99.9 /100 | #6 | Exceptional 10.1% |
| Filipinos | 99.9 /100 | #7 | Exceptional 10.1% |
| Maltese | 99.9 /100 | #8 | Exceptional 10.2% |
| Immigrants | South Central Asia | 99.9 /100 | #9 | Exceptional 10.2% |
| Bulgarians | 99.9 /100 | #10 | Exceptional 10.2% |
| Immigrants | Lithuania | 99.9 /100 | #11 | Exceptional 10.3% |
| Bhutanese | 99.8 /100 | #12 | Exceptional 10.4% |
| Immigrants | Hong Kong | 99.8 /100 | #13 | Exceptional 10.4% |
| Immigrants | Bolivia | 99.8 /100 | #14 | Exceptional 10.4% |
| Bolivians | 99.8 /100 | #15 | Exceptional 10.4% |
Demographics Similar to Sri Lankans by Poverty
In terms of poverty, the demographic groups most similar to Sri Lankans are Immigrants from Russia (11.7%, a difference of 0.070%), Argentinean (11.7%, a difference of 0.080%), Tlingit-Haida (11.7%, a difference of 0.12%), Immigrants from South Eastern Asia (11.7%, a difference of 0.13%), and New Zealander (11.7%, a difference of 0.19%).
| Demographics | Rating | Rank | Poverty |
| Welsh | 91.6 /100 | #110 | Exceptional 11.6% |
| French Canadians | 91.0 /100 | #111 | Exceptional 11.6% |
| Immigrants | Southern Europe | 90.8 /100 | #112 | Exceptional 11.6% |
| Immigrants | Belarus | 90.8 /100 | #113 | Exceptional 11.6% |
| Immigrants | China | 90.7 /100 | #114 | Exceptional 11.6% |
| Albanians | 90.3 /100 | #115 | Exceptional 11.7% |
| Immigrants | Russia | 89.7 /100 | #116 | Excellent 11.7% |
| Sri Lankans | 89.4 /100 | #117 | Excellent 11.7% |
| Argentineans | 89.1 /100 | #118 | Excellent 11.7% |
| Tlingit-Haida | 89.0 /100 | #119 | Excellent 11.7% |
| Immigrants | South Eastern Asia | 88.9 /100 | #120 | Excellent 11.7% |
| New Zealanders | 88.7 /100 | #121 | Excellent 11.7% |
| Puget Sound Salish | 88.7 /100 | #122 | Excellent 11.7% |
| Immigrants | Hungary | 88.6 /100 | #123 | Excellent 11.7% |
| Soviet Union | 88.4 /100 | #124 | Excellent 11.7% |