Indonesian vs Sri Lankan Poverty
COMPARE
Indonesian
Sri Lankan
Poverty
Poverty Comparison
Indonesians
Sri Lankans
15.1%
POVERTY
0.0/ 100
METRIC RATING
292nd/ 347
METRIC RANK
11.7%
POVERTY
89.4/ 100
METRIC RATING
117th/ 347
METRIC RANK
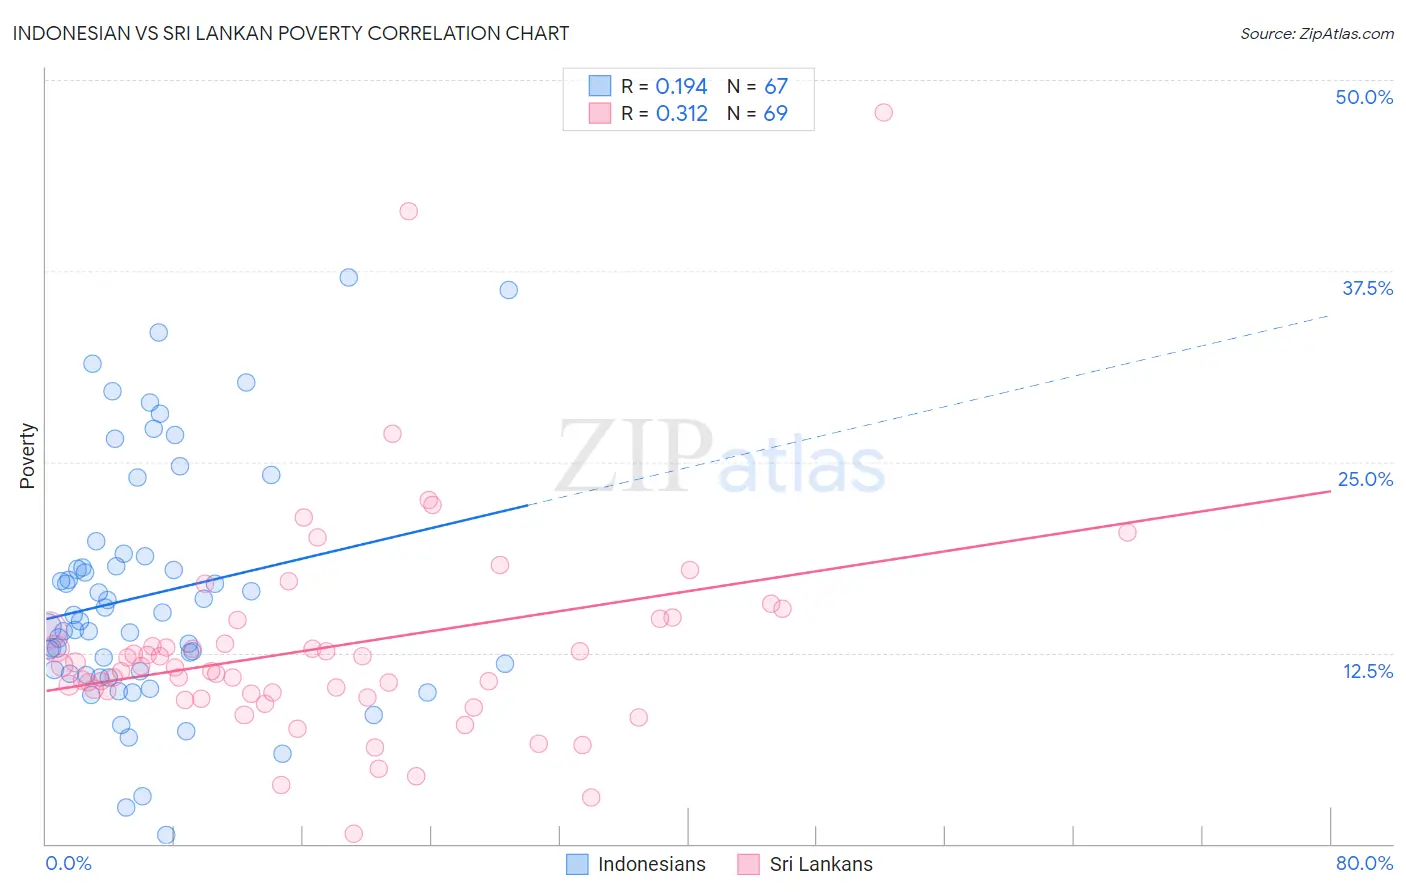
Indonesian vs Sri Lankan Poverty Correlation Chart
The statistical analysis conducted on geographies consisting of 162,655,405 people shows a poor positive correlation between the proportion of Indonesians and poverty level in the United States with a correlation coefficient (R) of 0.194 and weighted average of 15.1%. Similarly, the statistical analysis conducted on geographies consisting of 440,138,450 people shows a mild positive correlation between the proportion of Sri Lankans and poverty level in the United States with a correlation coefficient (R) of 0.312 and weighted average of 11.7%, a difference of 29.5%.
Poverty Correlation Summary
| Measurement | Indonesian | Sri Lankan |
| Minimum | 0.56% | 0.64% |
| Maximum | 37.0% | 47.9% |
| Range | 36.5% | 47.2% |
| Mean | 16.3% | 12.9% |
| Median | 14.6% | 11.5% |
| Interquartile 25% (IQ1) | 11.1% | 9.7% |
| Interquartile 75% (IQ3) | 18.9% | 14.3% |
| Interquartile Range (IQR) | 7.8% | 4.6% |
| Standard Deviation (Sample) | 7.9% | 7.2% |
| Standard Deviation (Population) | 7.9% | 7.2% |
Similar Demographics by Poverty
Demographics Similar to Indonesians by Poverty
In terms of poverty, the demographic groups most similar to Indonesians are Immigrants from Zaire (15.1%, a difference of 0.010%), Immigrants from Cabo Verde (15.1%, a difference of 0.050%), Mexican (15.1%, a difference of 0.18%), Immigrants from Belize (15.1%, a difference of 0.28%), and Yaqui (15.1%, a difference of 0.40%).
| Demographics | Rating | Rank | Poverty |
| Vietnamese | 0.0 /100 | #285 | Tragic 15.0% |
| Immigrants | Latin America | 0.0 /100 | #286 | Tragic 15.0% |
| Inupiat | 0.0 /100 | #287 | Tragic 15.1% |
| Yaqui | 0.0 /100 | #288 | Tragic 15.1% |
| Immigrants | Belize | 0.0 /100 | #289 | Tragic 15.1% |
| Mexicans | 0.0 /100 | #290 | Tragic 15.1% |
| Immigrants | Cabo Verde | 0.0 /100 | #291 | Tragic 15.1% |
| Indonesians | 0.0 /100 | #292 | Tragic 15.1% |
| Immigrants | Zaire | 0.0 /100 | #293 | Tragic 15.1% |
| Blackfeet | 0.0 /100 | #294 | Tragic 15.2% |
| Guatemalans | 0.0 /100 | #295 | Tragic 15.3% |
| Hispanics or Latinos | 0.0 /100 | #296 | Tragic 15.3% |
| Immigrants | Bangladesh | 0.0 /100 | #297 | Tragic 15.3% |
| Immigrants | Senegal | 0.0 /100 | #298 | Tragic 15.3% |
| Senegalese | 0.0 /100 | #299 | Tragic 15.3% |
Demographics Similar to Sri Lankans by Poverty
In terms of poverty, the demographic groups most similar to Sri Lankans are Immigrants from Russia (11.7%, a difference of 0.070%), Argentinean (11.7%, a difference of 0.080%), Tlingit-Haida (11.7%, a difference of 0.12%), Immigrants from South Eastern Asia (11.7%, a difference of 0.13%), and New Zealander (11.7%, a difference of 0.19%).
| Demographics | Rating | Rank | Poverty |
| Welsh | 91.6 /100 | #110 | Exceptional 11.6% |
| French Canadians | 91.0 /100 | #111 | Exceptional 11.6% |
| Immigrants | Southern Europe | 90.8 /100 | #112 | Exceptional 11.6% |
| Immigrants | Belarus | 90.8 /100 | #113 | Exceptional 11.6% |
| Immigrants | China | 90.7 /100 | #114 | Exceptional 11.6% |
| Albanians | 90.3 /100 | #115 | Exceptional 11.7% |
| Immigrants | Russia | 89.7 /100 | #116 | Excellent 11.7% |
| Sri Lankans | 89.4 /100 | #117 | Excellent 11.7% |
| Argentineans | 89.1 /100 | #118 | Excellent 11.7% |
| Tlingit-Haida | 89.0 /100 | #119 | Excellent 11.7% |
| Immigrants | South Eastern Asia | 88.9 /100 | #120 | Excellent 11.7% |
| New Zealanders | 88.7 /100 | #121 | Excellent 11.7% |
| Puget Sound Salish | 88.7 /100 | #122 | Excellent 11.7% |
| Immigrants | Hungary | 88.6 /100 | #123 | Excellent 11.7% |
| Soviet Union | 88.4 /100 | #124 | Excellent 11.7% |