Ethiopian vs Navajo 12th Grade, No Diploma
COMPARE
Ethiopian
Navajo
12th Grade, No Diploma
12th Grade, No Diploma Comparison
Ethiopians
Navajo
91.0%
12TH GRADE, NO DIPLOMA
33.9/ 100
METRIC RATING
186th/ 347
METRIC RANK
87.1%
12TH GRADE, NO DIPLOMA
0.0/ 100
METRIC RATING
317th/ 347
METRIC RANK
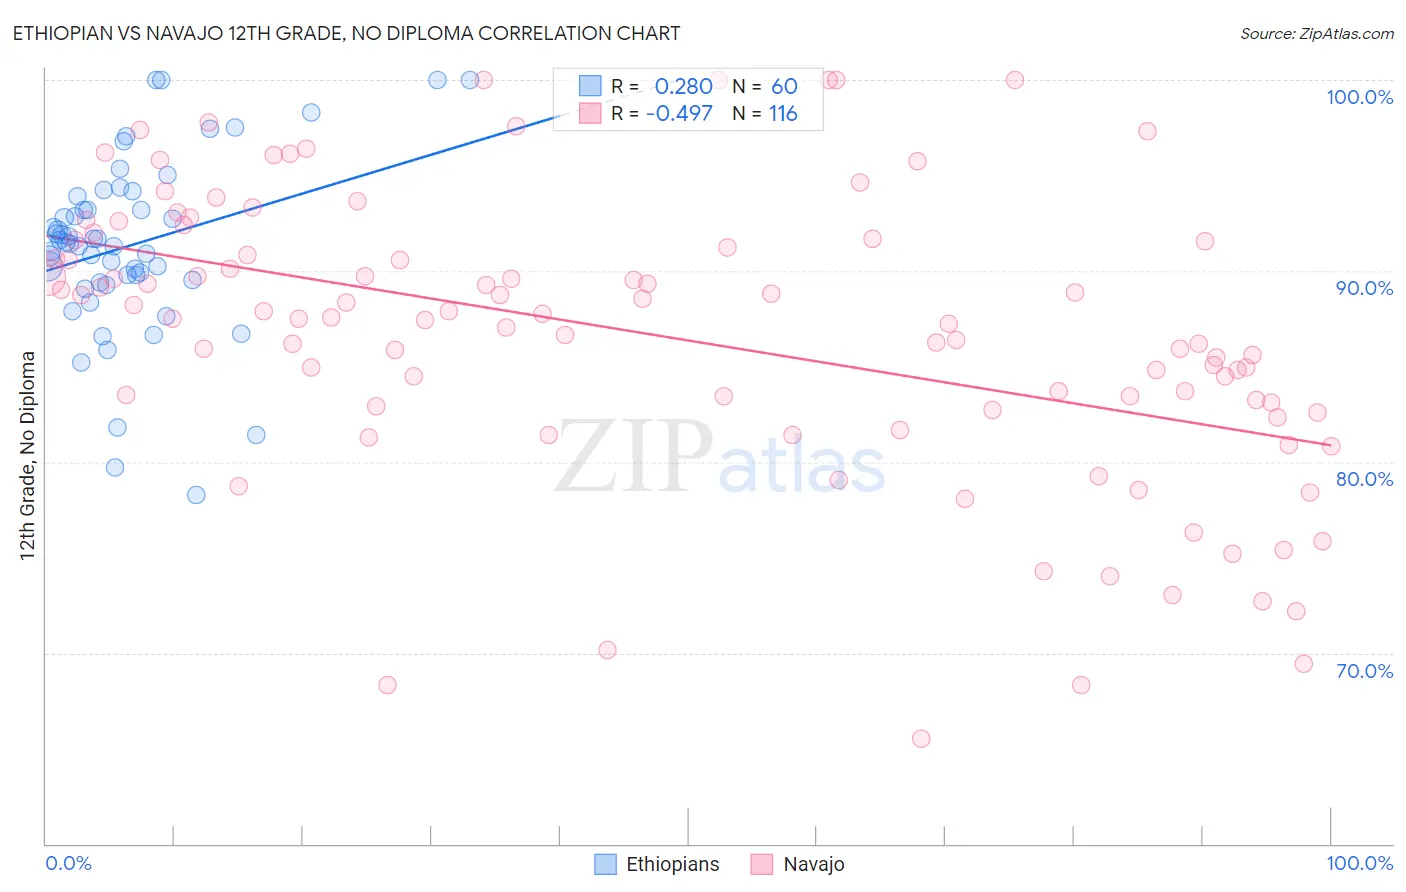
Ethiopian vs Navajo 12th Grade, No Diploma Correlation Chart
The statistical analysis conducted on geographies consisting of 223,161,778 people shows a weak positive correlation between the proportion of Ethiopians and percentage of population with at least 12th grade (no diploma) education in the United States with a correlation coefficient (R) of 0.280 and weighted average of 91.0%. Similarly, the statistical analysis conducted on geographies consisting of 224,872,856 people shows a moderate negative correlation between the proportion of Navajo and percentage of population with at least 12th grade (no diploma) education in the United States with a correlation coefficient (R) of -0.497 and weighted average of 87.1%, a difference of 4.5%.
12th Grade, No Diploma Correlation Summary
| Measurement | Ethiopian | Navajo |
| Minimum | 78.2% | 65.5% |
| Maximum | 100.0% | 100.0% |
| Range | 21.8% | 34.5% |
| Mean | 91.3% | 86.6% |
| Median | 91.4% | 87.5% |
| Interquartile 25% (IQ1) | 89.4% | 82.8% |
| Interquartile 75% (IQ3) | 93.6% | 91.4% |
| Interquartile Range (IQR) | 4.1% | 8.6% |
| Standard Deviation (Sample) | 4.6% | 7.5% |
| Standard Deviation (Population) | 4.6% | 7.5% |
Similar Demographics by 12th Grade, No Diploma
Demographics Similar to Ethiopians by 12th Grade, No Diploma
In terms of 12th grade, no diploma, the demographic groups most similar to Ethiopians are Sudanese (91.0%, a difference of 0.010%), Potawatomi (91.0%, a difference of 0.010%), American (91.0%, a difference of 0.020%), Spaniard (91.0%, a difference of 0.030%), and Immigrants from Uganda (90.9%, a difference of 0.030%).
| Demographics | Rating | Rank | 12th Grade, No Diploma |
| Immigrants | Chile | 43.3 /100 | #179 | Average 91.1% |
| Immigrants | Syria | 40.3 /100 | #180 | Average 91.1% |
| Guamanians/Chamorros | 39.5 /100 | #181 | Fair 91.0% |
| Immigrants | Nonimmigrants | 38.8 /100 | #182 | Fair 91.0% |
| Osage | 38.3 /100 | #183 | Fair 91.0% |
| Spaniards | 36.2 /100 | #184 | Fair 91.0% |
| Sudanese | 34.4 /100 | #185 | Fair 91.0% |
| Ethiopians | 33.9 /100 | #186 | Fair 91.0% |
| Potawatomi | 32.9 /100 | #187 | Fair 91.0% |
| Americans | 32.6 /100 | #188 | Fair 91.0% |
| Immigrants | Uganda | 31.6 /100 | #189 | Fair 90.9% |
| Afghans | 29.9 /100 | #190 | Fair 90.9% |
| Moroccans | 28.8 /100 | #191 | Fair 90.9% |
| Immigrants | Eastern Africa | 27.7 /100 | #192 | Fair 90.9% |
| Immigrants | Ethiopia | 27.2 /100 | #193 | Fair 90.9% |
Demographics Similar to Navajo by 12th Grade, No Diploma
In terms of 12th grade, no diploma, the demographic groups most similar to Navajo are Belizean (87.0%, a difference of 0.060%), Immigrants from Belize (87.0%, a difference of 0.14%), Apache (87.3%, a difference of 0.28%), Nicaraguan (87.3%, a difference of 0.30%), and Cape Verdean (87.4%, a difference of 0.33%).
| Demographics | Rating | Rank | 12th Grade, No Diploma |
| Immigrants | Cuba | 0.0 /100 | #310 | Tragic 87.5% |
| Yaqui | 0.0 /100 | #311 | Tragic 87.5% |
| Immigrants | Ecuador | 0.0 /100 | #312 | Tragic 87.5% |
| Immigrants | Caribbean | 0.0 /100 | #313 | Tragic 87.4% |
| Cape Verdeans | 0.0 /100 | #314 | Tragic 87.4% |
| Nicaraguans | 0.0 /100 | #315 | Tragic 87.3% |
| Apache | 0.0 /100 | #316 | Tragic 87.3% |
| Navajo | 0.0 /100 | #317 | Tragic 87.1% |
| Belizeans | 0.0 /100 | #318 | Tragic 87.0% |
| Immigrants | Belize | 0.0 /100 | #319 | Tragic 87.0% |
| Immigrants | Nicaragua | 0.0 /100 | #320 | Tragic 86.6% |
| Puerto Ricans | 0.0 /100 | #321 | Tragic 86.5% |
| Central American Indians | 0.0 /100 | #322 | Tragic 86.5% |
| Yuman | 0.0 /100 | #323 | Tragic 86.5% |
| Immigrants | Cabo Verde | 0.0 /100 | #324 | Tragic 85.8% |