Ethiopian vs Navajo 4th Grade
COMPARE
Ethiopian
Navajo
4th Grade
4th Grade Comparison
Ethiopians
Navajo
97.1%
4TH GRADE
1.2/ 100
METRIC RATING
247th/ 347
METRIC RANK
97.4%
4TH GRADE
30.7/ 100
METRIC RATING
191st/ 347
METRIC RANK
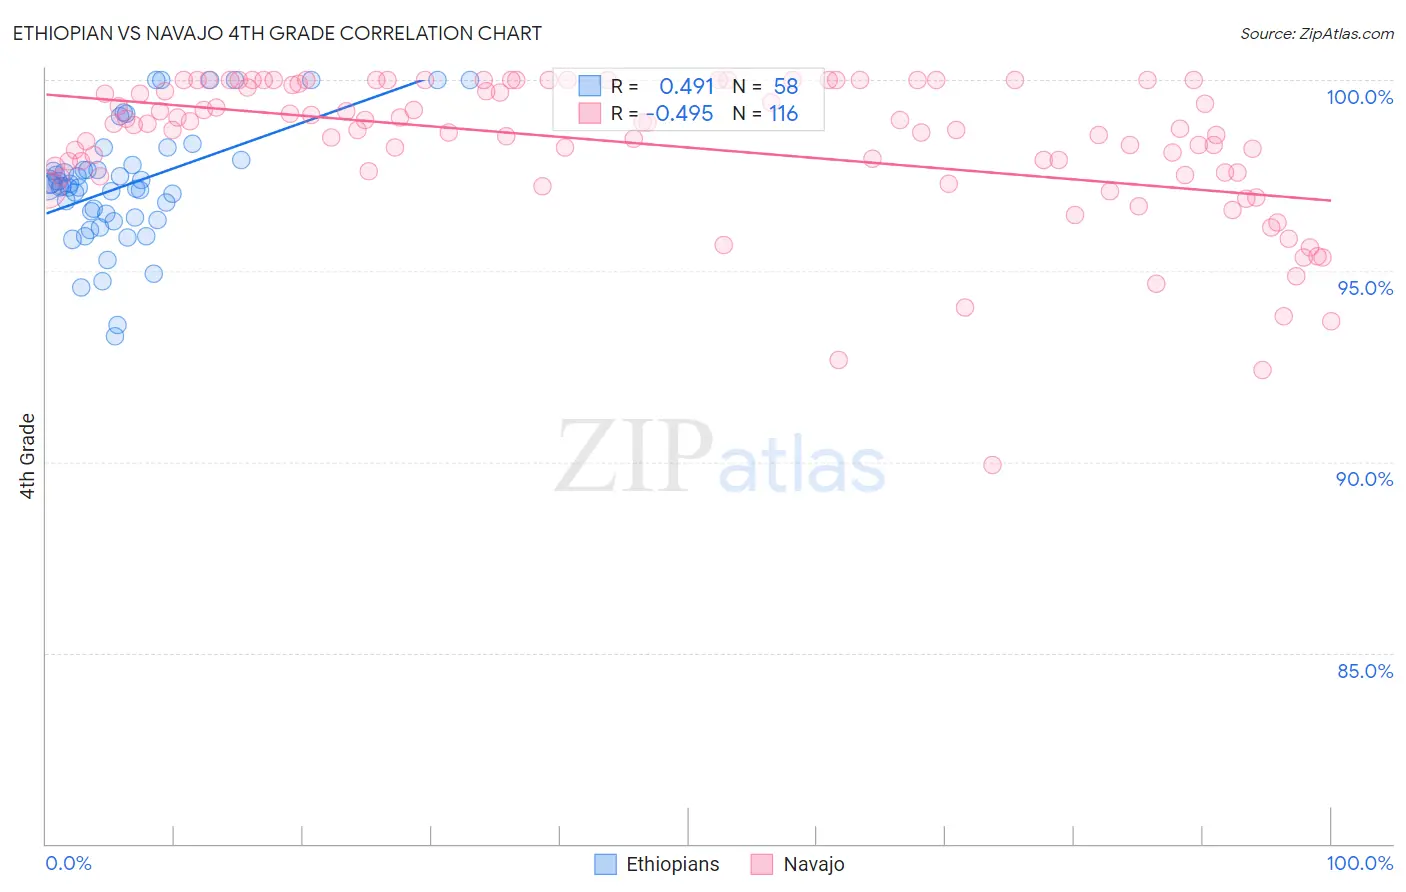
Ethiopian vs Navajo 4th Grade Correlation Chart
The statistical analysis conducted on geographies consisting of 223,120,541 people shows a moderate positive correlation between the proportion of Ethiopians and percentage of population with at least 4th grade education in the United States with a correlation coefficient (R) of 0.491 and weighted average of 97.1%. Similarly, the statistical analysis conducted on geographies consisting of 224,872,987 people shows a moderate negative correlation between the proportion of Navajo and percentage of population with at least 4th grade education in the United States with a correlation coefficient (R) of -0.495 and weighted average of 97.4%, a difference of 0.34%.
4th Grade Correlation Summary
| Measurement | Ethiopian | Navajo |
| Minimum | 93.3% | 89.9% |
| Maximum | 100.0% | 100.0% |
| Range | 6.7% | 10.1% |
| Mean | 97.3% | 98.3% |
| Median | 97.2% | 98.8% |
| Interquartile 25% (IQ1) | 96.4% | 97.6% |
| Interquartile 75% (IQ3) | 97.8% | 99.9% |
| Interquartile Range (IQR) | 1.3% | 2.4% |
| Standard Deviation (Sample) | 1.5% | 1.9% |
| Standard Deviation (Population) | 1.5% | 1.9% |
Similar Demographics by 4th Grade
Demographics Similar to Ethiopians by 4th Grade
In terms of 4th grade, the demographic groups most similar to Ethiopians are Korean (97.1%, a difference of 0.0%), Immigrants from Eastern Africa (97.1%, a difference of 0.0%), Immigrants from Uruguay (97.1%, a difference of 0.0%), Immigrants from Asia (97.1%, a difference of 0.0%), and Asian (97.1%, a difference of 0.010%).
| Demographics | Rating | Rank | 4th Grade |
| Colombians | 1.6 /100 | #240 | Tragic 97.1% |
| Immigrants | Indonesia | 1.5 /100 | #241 | Tragic 97.1% |
| Asians | 1.4 /100 | #242 | Tragic 97.1% |
| U.S. Virgin Islanders | 1.4 /100 | #243 | Tragic 97.1% |
| Koreans | 1.3 /100 | #244 | Tragic 97.1% |
| Immigrants | Eastern Africa | 1.2 /100 | #245 | Tragic 97.1% |
| Immigrants | Uruguay | 1.2 /100 | #246 | Tragic 97.1% |
| Ethiopians | 1.2 /100 | #247 | Tragic 97.1% |
| Immigrants | Asia | 1.2 /100 | #248 | Tragic 97.1% |
| Immigrants | Africa | 1.0 /100 | #249 | Tragic 97.1% |
| Immigrants | Senegal | 0.9 /100 | #250 | Tragic 97.1% |
| South Americans | 0.8 /100 | #251 | Tragic 97.1% |
| Jamaicans | 0.8 /100 | #252 | Tragic 97.1% |
| Immigrants | Liberia | 0.8 /100 | #253 | Tragic 97.1% |
| Immigrants | Middle Africa | 0.8 /100 | #254 | Tragic 97.1% |
Demographics Similar to Navajo by 4th Grade
In terms of 4th grade, the demographic groups most similar to Navajo are Black/African American (97.4%, a difference of 0.0%), Immigrants from Ukraine (97.4%, a difference of 0.0%), Immigrants from Egypt (97.4%, a difference of 0.0%), Panamanian (97.4%, a difference of 0.010%), and Portuguese (97.4%, a difference of 0.010%).
| Demographics | Rating | Rank | 4th Grade |
| Pakistanis | 36.2 /100 | #184 | Fair 97.5% |
| Immigrants | Kenya | 35.8 /100 | #185 | Fair 97.5% |
| Dutch West Indians | 35.8 /100 | #186 | Fair 97.5% |
| Mongolians | 34.7 /100 | #187 | Fair 97.5% |
| Immigrants | Argentina | 34.6 /100 | #188 | Fair 97.5% |
| Panamanians | 31.9 /100 | #189 | Fair 97.4% |
| Blacks/African Americans | 31.1 /100 | #190 | Fair 97.4% |
| Navajo | 30.7 /100 | #191 | Fair 97.4% |
| Immigrants | Ukraine | 30.1 /100 | #192 | Fair 97.4% |
| Immigrants | Egypt | 30.1 /100 | #193 | Fair 97.4% |
| Portuguese | 29.2 /100 | #194 | Fair 97.4% |
| Paraguayans | 28.9 /100 | #195 | Fair 97.4% |
| Immigrants | Albania | 27.7 /100 | #196 | Fair 97.4% |
| Hawaiians | 25.6 /100 | #197 | Fair 97.4% |
| Guamanians/Chamorros | 23.0 /100 | #198 | Fair 97.4% |