Ethiopian vs Navajo Seniors Poverty Over the Age of 65
COMPARE
Ethiopian
Navajo
Seniors Poverty Over the Age of 65
Seniors Poverty Over the Age of 65 Comparison
Ethiopians
Navajo
10.7%
SENIORS POVERTY OVER THE AGE OF 65
72.9/ 100
METRIC RATING
156th/ 347
METRIC RANK
17.5%
SENIORS POVERTY OVER THE AGE OF 65
0.0/ 100
METRIC RATING
339th/ 347
METRIC RANK
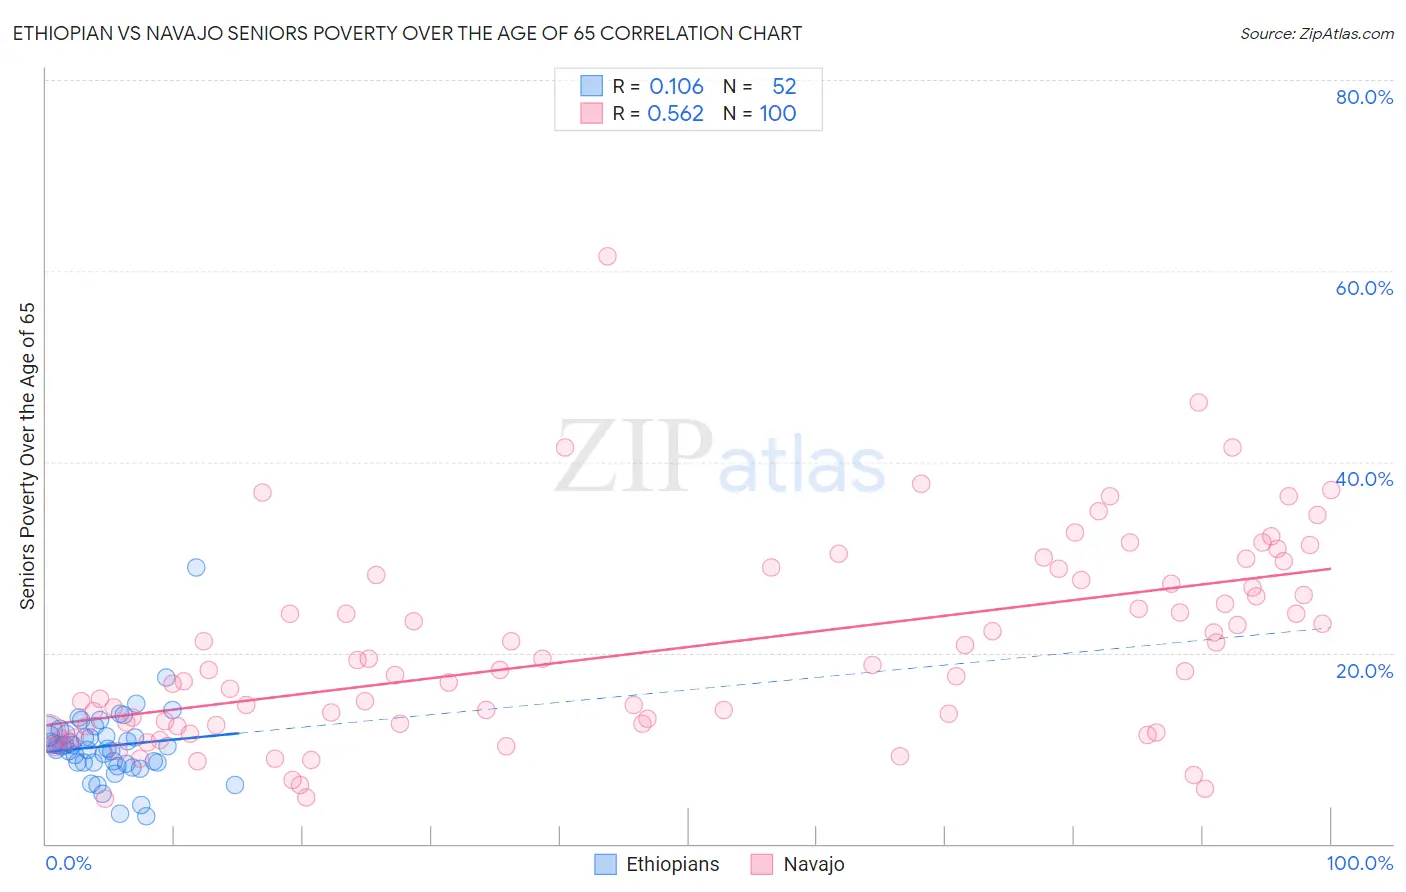
Ethiopian vs Navajo Seniors Poverty Over the Age of 65 Correlation Chart
The statistical analysis conducted on geographies consisting of 222,742,361 people shows a poor positive correlation between the proportion of Ethiopians and poverty level among seniors over the age of 65 in the United States with a correlation coefficient (R) of 0.106 and weighted average of 10.7%. Similarly, the statistical analysis conducted on geographies consisting of 223,980,676 people shows a substantial positive correlation between the proportion of Navajo and poverty level among seniors over the age of 65 in the United States with a correlation coefficient (R) of 0.562 and weighted average of 17.5%, a difference of 63.2%.
Seniors Poverty Over the Age of 65 Correlation Summary
| Measurement | Ethiopian | Navajo |
| Minimum | 2.9% | 4.8% |
| Maximum | 28.9% | 61.5% |
| Range | 26.0% | 56.8% |
| Mean | 10.2% | 20.3% |
| Median | 10.3% | 18.1% |
| Interquartile 25% (IQ1) | 8.5% | 12.3% |
| Interquartile 75% (IQ3) | 11.4% | 27.5% |
| Interquartile Range (IQR) | 2.9% | 15.1% |
| Standard Deviation (Sample) | 3.9% | 10.4% |
| Standard Deviation (Population) | 3.8% | 10.4% |
Similar Demographics by Seniors Poverty Over the Age of 65
Demographics Similar to Ethiopians by Seniors Poverty Over the Age of 65
In terms of seniors poverty over the age of 65, the demographic groups most similar to Ethiopians are Immigrants from Ethiopia (10.7%, a difference of 0.010%), Chickasaw (10.7%, a difference of 0.070%), Immigrants from Sierra Leone (10.7%, a difference of 0.15%), Immigrants from Saudi Arabia (10.7%, a difference of 0.23%), and Immigrants from Micronesia (10.7%, a difference of 0.24%).
| Demographics | Rating | Rank | Seniors Poverty Over the Age of 65 |
| Immigrants | Cameroon | 78.1 /100 | #149 | Good 10.6% |
| Immigrants | Switzerland | 77.3 /100 | #150 | Good 10.6% |
| Spanish | 76.8 /100 | #151 | Good 10.6% |
| Immigrants | Egypt | 76.5 /100 | #152 | Good 10.6% |
| Fijians | 75.6 /100 | #153 | Good 10.7% |
| Immigrants | Saudi Arabia | 74.9 /100 | #154 | Good 10.7% |
| Chickasaw | 73.6 /100 | #155 | Good 10.7% |
| Ethiopians | 72.9 /100 | #156 | Good 10.7% |
| Immigrants | Ethiopia | 72.9 /100 | #157 | Good 10.7% |
| Immigrants | Sierra Leone | 71.7 /100 | #158 | Good 10.7% |
| Immigrants | Micronesia | 70.8 /100 | #159 | Good 10.7% |
| Sudanese | 68.2 /100 | #160 | Good 10.7% |
| Arabs | 65.2 /100 | #161 | Good 10.8% |
| Immigrants | Indonesia | 64.8 /100 | #162 | Good 10.8% |
| Tsimshian | 64.5 /100 | #163 | Good 10.8% |
Demographics Similar to Navajo by Seniors Poverty Over the Age of 65
In terms of seniors poverty over the age of 65, the demographic groups most similar to Navajo are Pueblo (17.2%, a difference of 1.5%), Hopi (17.8%, a difference of 1.9%), Dominican (17.8%, a difference of 2.3%), Immigrants from Cuba (17.9%, a difference of 2.8%), and Lumbee (18.1%, a difference of 3.9%).
| Demographics | Rating | Rank | Seniors Poverty Over the Age of 65 |
| Immigrants | Grenada | 0.0 /100 | #332 | Tragic 15.8% |
| Immigrants | Yemen | 0.0 /100 | #333 | Tragic 15.9% |
| Immigrants | Nicaragua | 0.0 /100 | #334 | Tragic 15.9% |
| Cubans | 0.0 /100 | #335 | Tragic 16.1% |
| Immigrants | Cabo Verde | 0.0 /100 | #336 | Tragic 16.2% |
| Immigrants | Caribbean | 0.0 /100 | #337 | Tragic 16.5% |
| Pueblo | 0.0 /100 | #338 | Tragic 17.2% |
| Navajo | 0.0 /100 | #339 | Tragic 17.5% |
| Hopi | 0.0 /100 | #340 | Tragic 17.8% |
| Dominicans | 0.0 /100 | #341 | Tragic 17.8% |
| Immigrants | Cuba | 0.0 /100 | #342 | Tragic 17.9% |
| Lumbee | 0.0 /100 | #343 | Tragic 18.1% |
| Immigrants | Dominican Republic | 0.0 /100 | #344 | Tragic 18.3% |
| Pima | 0.0 /100 | #345 | Tragic 19.8% |
| Tohono O'odham | 0.0 /100 | #346 | Tragic 20.8% |