English vs Immigrants from Somalia Male Poverty
COMPARE
English
Immigrants from Somalia
Male Poverty
Male Poverty Comparison
English
Immigrants from Somalia
10.3%
MALE POVERTY
96.4/ 100
METRIC RATING
80th/ 347
METRIC RANK
14.6%
MALE POVERTY
0.0/ 100
METRIC RATING
313th/ 347
METRIC RANK
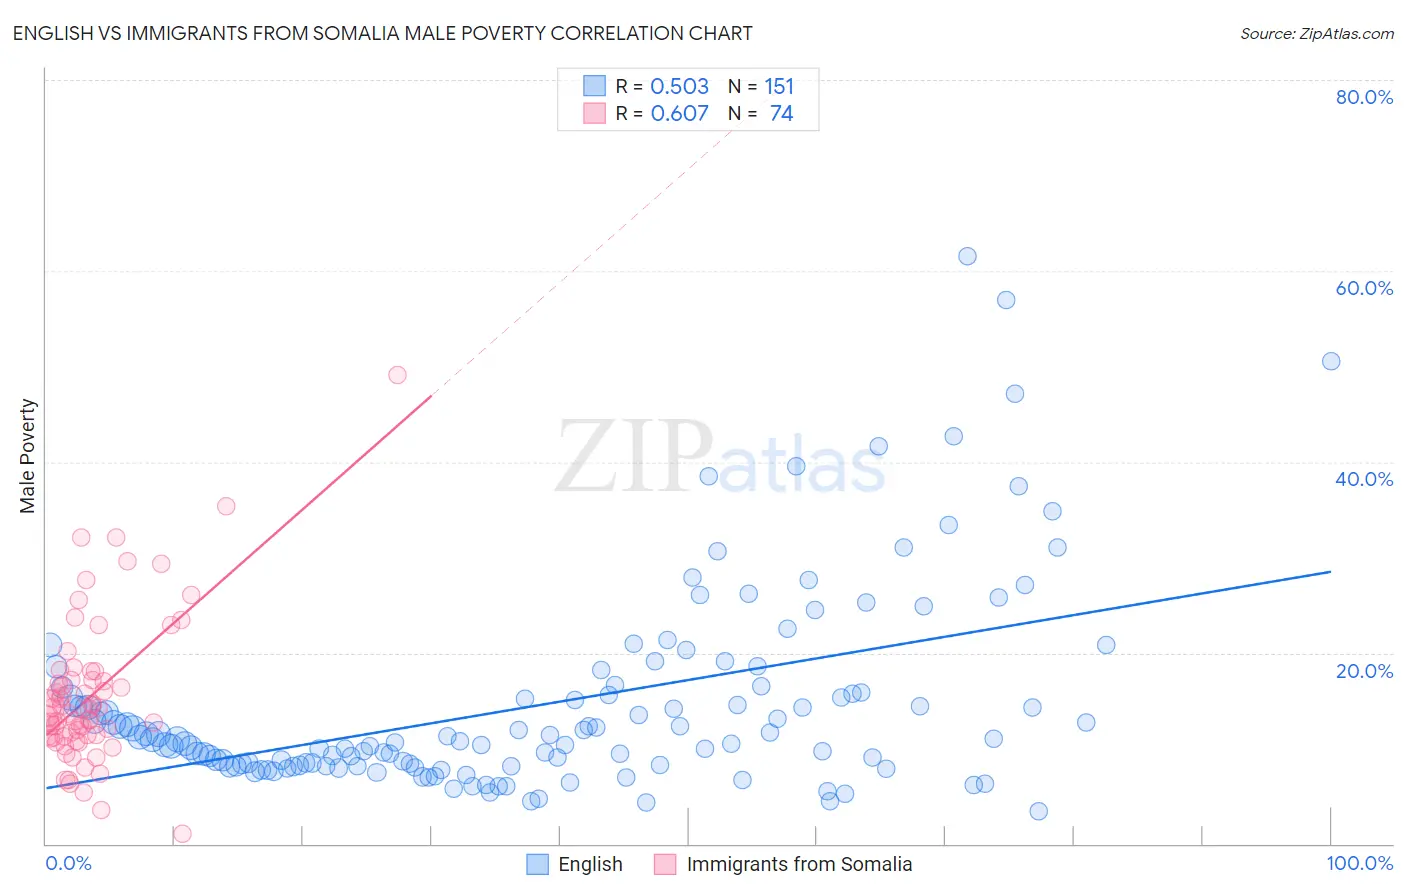
English vs Immigrants from Somalia Male Poverty Correlation Chart
The statistical analysis conducted on geographies consisting of 577,651,479 people shows a substantial positive correlation between the proportion of English and poverty level among males in the United States with a correlation coefficient (R) of 0.503 and weighted average of 10.3%. Similarly, the statistical analysis conducted on geographies consisting of 92,092,836 people shows a significant positive correlation between the proportion of Immigrants from Somalia and poverty level among males in the United States with a correlation coefficient (R) of 0.607 and weighted average of 14.6%, a difference of 41.7%.
Male Poverty Correlation Summary
| Measurement | English | Immigrants from Somalia |
| Minimum | 3.5% | 1.0% |
| Maximum | 61.6% | 49.1% |
| Range | 58.1% | 48.1% |
| Mean | 14.6% | 15.5% |
| Median | 10.9% | 13.8% |
| Interquartile 25% (IQ1) | 8.2% | 11.3% |
| Interquartile 75% (IQ3) | 15.8% | 17.2% |
| Interquartile Range (IQR) | 7.7% | 5.9% |
| Standard Deviation (Sample) | 10.4% | 7.8% |
| Standard Deviation (Population) | 10.4% | 7.7% |
Similar Demographics by Male Poverty
Demographics Similar to English by Male Poverty
In terms of male poverty, the demographic groups most similar to English are Immigrants from North America (10.3%, a difference of 0.080%), Irish (10.3%, a difference of 0.32%), Immigrants from Belgium (10.3%, a difference of 0.34%), Dutch (10.2%, a difference of 0.37%), and Immigrants from Eastern Europe (10.2%, a difference of 0.38%).
| Demographics | Rating | Rank | Male Poverty |
| Immigrants | Asia | 97.0 /100 | #73 | Exceptional 10.2% |
| Immigrants | Eastern Europe | 96.9 /100 | #74 | Exceptional 10.2% |
| Carpatho Rusyns | 96.9 /100 | #75 | Exceptional 10.2% |
| Dutch | 96.9 /100 | #76 | Exceptional 10.2% |
| Immigrants | Belgium | 96.8 /100 | #77 | Exceptional 10.3% |
| Irish | 96.8 /100 | #78 | Exceptional 10.3% |
| Immigrants | North America | 96.5 /100 | #79 | Exceptional 10.3% |
| English | 96.4 /100 | #80 | Exceptional 10.3% |
| Belgians | 95.9 /100 | #81 | Exceptional 10.3% |
| Egyptians | 95.9 /100 | #82 | Exceptional 10.3% |
| Immigrants | Sweden | 95.7 /100 | #83 | Exceptional 10.3% |
| Czechoslovakians | 95.6 /100 | #84 | Exceptional 10.3% |
| Immigrants | England | 95.5 /100 | #85 | Exceptional 10.4% |
| Immigrants | Eastern Asia | 95.3 /100 | #86 | Exceptional 10.4% |
| Northern Europeans | 95.2 /100 | #87 | Exceptional 10.4% |
Demographics Similar to Immigrants from Somalia by Male Poverty
In terms of male poverty, the demographic groups most similar to Immigrants from Somalia are Immigrants from Honduras (14.6%, a difference of 0.040%), Chippewa (14.6%, a difference of 0.11%), British West Indian (14.6%, a difference of 0.14%), Immigrants from Dominica (14.7%, a difference of 0.82%), and Immigrants from Grenada (14.7%, a difference of 0.87%).
| Demographics | Rating | Rank | Male Poverty |
| Creek | 0.0 /100 | #306 | Tragic 14.1% |
| Dutch West Indians | 0.0 /100 | #307 | Tragic 14.2% |
| Africans | 0.0 /100 | #308 | Tragic 14.2% |
| Somalis | 0.0 /100 | #309 | Tragic 14.3% |
| Seminole | 0.0 /100 | #310 | Tragic 14.3% |
| Hondurans | 0.0 /100 | #311 | Tragic 14.3% |
| Choctaw | 0.0 /100 | #312 | Tragic 14.4% |
| Immigrants | Somalia | 0.0 /100 | #313 | Tragic 14.6% |
| Immigrants | Honduras | 0.0 /100 | #314 | Tragic 14.6% |
| Chippewa | 0.0 /100 | #315 | Tragic 14.6% |
| British West Indians | 0.0 /100 | #316 | Tragic 14.6% |
| Immigrants | Dominica | 0.0 /100 | #317 | Tragic 14.7% |
| Immigrants | Grenada | 0.0 /100 | #318 | Tragic 14.7% |
| U.S. Virgin Islanders | 0.0 /100 | #319 | Tragic 14.7% |
| Immigrants | Congo | 0.0 /100 | #320 | Tragic 14.7% |