English vs Immigrants from Iran Male Poverty
COMPARE
English
Immigrants from Iran
Male Poverty
Male Poverty Comparison
English
Immigrants from Iran
10.3%
MALE POVERTY
96.4/ 100
METRIC RATING
80th/ 347
METRIC RANK
9.9%
MALE POVERTY
99.1/ 100
METRIC RATING
42nd/ 347
METRIC RANK
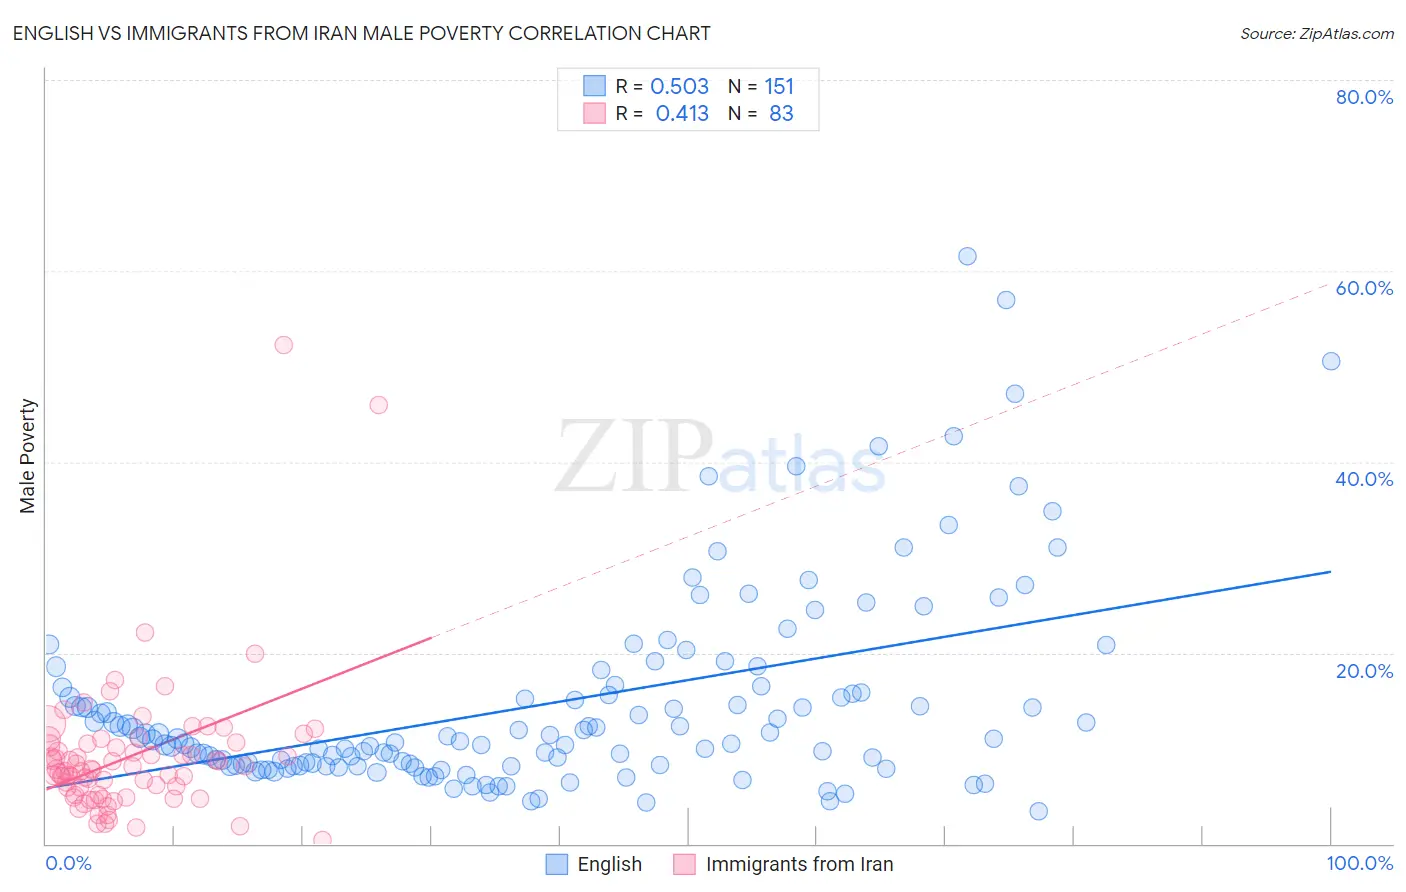
English vs Immigrants from Iran Male Poverty Correlation Chart
The statistical analysis conducted on geographies consisting of 577,651,479 people shows a substantial positive correlation between the proportion of English and poverty level among males in the United States with a correlation coefficient (R) of 0.503 and weighted average of 10.3%. Similarly, the statistical analysis conducted on geographies consisting of 279,773,882 people shows a moderate positive correlation between the proportion of Immigrants from Iran and poverty level among males in the United States with a correlation coefficient (R) of 0.413 and weighted average of 9.9%, a difference of 3.9%.
Male Poverty Correlation Summary
| Measurement | English | Immigrants from Iran |
| Minimum | 3.5% | 0.33% |
| Maximum | 61.6% | 52.3% |
| Range | 58.1% | 51.9% |
| Mean | 14.6% | 9.2% |
| Median | 10.9% | 7.8% |
| Interquartile 25% (IQ1) | 8.2% | 5.1% |
| Interquartile 75% (IQ3) | 15.8% | 10.5% |
| Interquartile Range (IQR) | 7.7% | 5.4% |
| Standard Deviation (Sample) | 10.4% | 7.5% |
| Standard Deviation (Population) | 10.4% | 7.4% |
Similar Demographics by Male Poverty
Demographics Similar to English by Male Poverty
In terms of male poverty, the demographic groups most similar to English are Immigrants from North America (10.3%, a difference of 0.080%), Irish (10.3%, a difference of 0.32%), Immigrants from Belgium (10.3%, a difference of 0.34%), Dutch (10.2%, a difference of 0.37%), and Immigrants from Eastern Europe (10.2%, a difference of 0.38%).
| Demographics | Rating | Rank | Male Poverty |
| Immigrants | Asia | 97.0 /100 | #73 | Exceptional 10.2% |
| Immigrants | Eastern Europe | 96.9 /100 | #74 | Exceptional 10.2% |
| Carpatho Rusyns | 96.9 /100 | #75 | Exceptional 10.2% |
| Dutch | 96.9 /100 | #76 | Exceptional 10.2% |
| Immigrants | Belgium | 96.8 /100 | #77 | Exceptional 10.3% |
| Irish | 96.8 /100 | #78 | Exceptional 10.3% |
| Immigrants | North America | 96.5 /100 | #79 | Exceptional 10.3% |
| English | 96.4 /100 | #80 | Exceptional 10.3% |
| Belgians | 95.9 /100 | #81 | Exceptional 10.3% |
| Egyptians | 95.9 /100 | #82 | Exceptional 10.3% |
| Immigrants | Sweden | 95.7 /100 | #83 | Exceptional 10.3% |
| Czechoslovakians | 95.6 /100 | #84 | Exceptional 10.3% |
| Immigrants | England | 95.5 /100 | #85 | Exceptional 10.4% |
| Immigrants | Eastern Asia | 95.3 /100 | #86 | Exceptional 10.4% |
| Northern Europeans | 95.2 /100 | #87 | Exceptional 10.4% |
Demographics Similar to Immigrants from Iran by Male Poverty
In terms of male poverty, the demographic groups most similar to Immigrants from Iran are Korean (9.9%, a difference of 0.24%), Immigrants from Moldova (9.9%, a difference of 0.26%), Cypriot (9.9%, a difference of 0.34%), Immigrants from Pakistan (9.9%, a difference of 0.42%), and Russian (9.9%, a difference of 0.42%).
| Demographics | Rating | Rank | Male Poverty |
| Iranians | 99.4 /100 | #35 | Exceptional 9.8% |
| Czechs | 99.4 /100 | #36 | Exceptional 9.8% |
| Immigrants | Greece | 99.3 /100 | #37 | Exceptional 9.8% |
| Immigrants | Pakistan | 99.2 /100 | #38 | Exceptional 9.9% |
| Russians | 99.2 /100 | #39 | Exceptional 9.9% |
| Cypriots | 99.2 /100 | #40 | Exceptional 9.9% |
| Koreans | 99.2 /100 | #41 | Exceptional 9.9% |
| Immigrants | Iran | 99.1 /100 | #42 | Exceptional 9.9% |
| Immigrants | Moldova | 99.0 /100 | #43 | Exceptional 9.9% |
| Immigrants | Romania | 98.9 /100 | #44 | Exceptional 9.9% |
| Immigrants | Serbia | 98.9 /100 | #45 | Exceptional 10.0% |
| Turks | 98.9 /100 | #46 | Exceptional 10.0% |
| Immigrants | Singapore | 98.8 /100 | #47 | Exceptional 10.0% |
| Immigrants | Japan | 98.8 /100 | #48 | Exceptional 10.0% |
| Slovenes | 98.8 /100 | #49 | Exceptional 10.0% |