Ecuadorian vs Puget Sound Salish Median Family Income
COMPARE
Ecuadorian
Puget Sound Salish
Median Family Income
Median Family Income Comparison
Ecuadorians
Puget Sound Salish
$95,114
MEDIAN FAMILY INCOME
2.1/ 100
METRIC RATING
231st/ 347
METRIC RANK
$97,958
MEDIAN FAMILY INCOME
8.2/ 100
METRIC RATING
210th/ 347
METRIC RANK
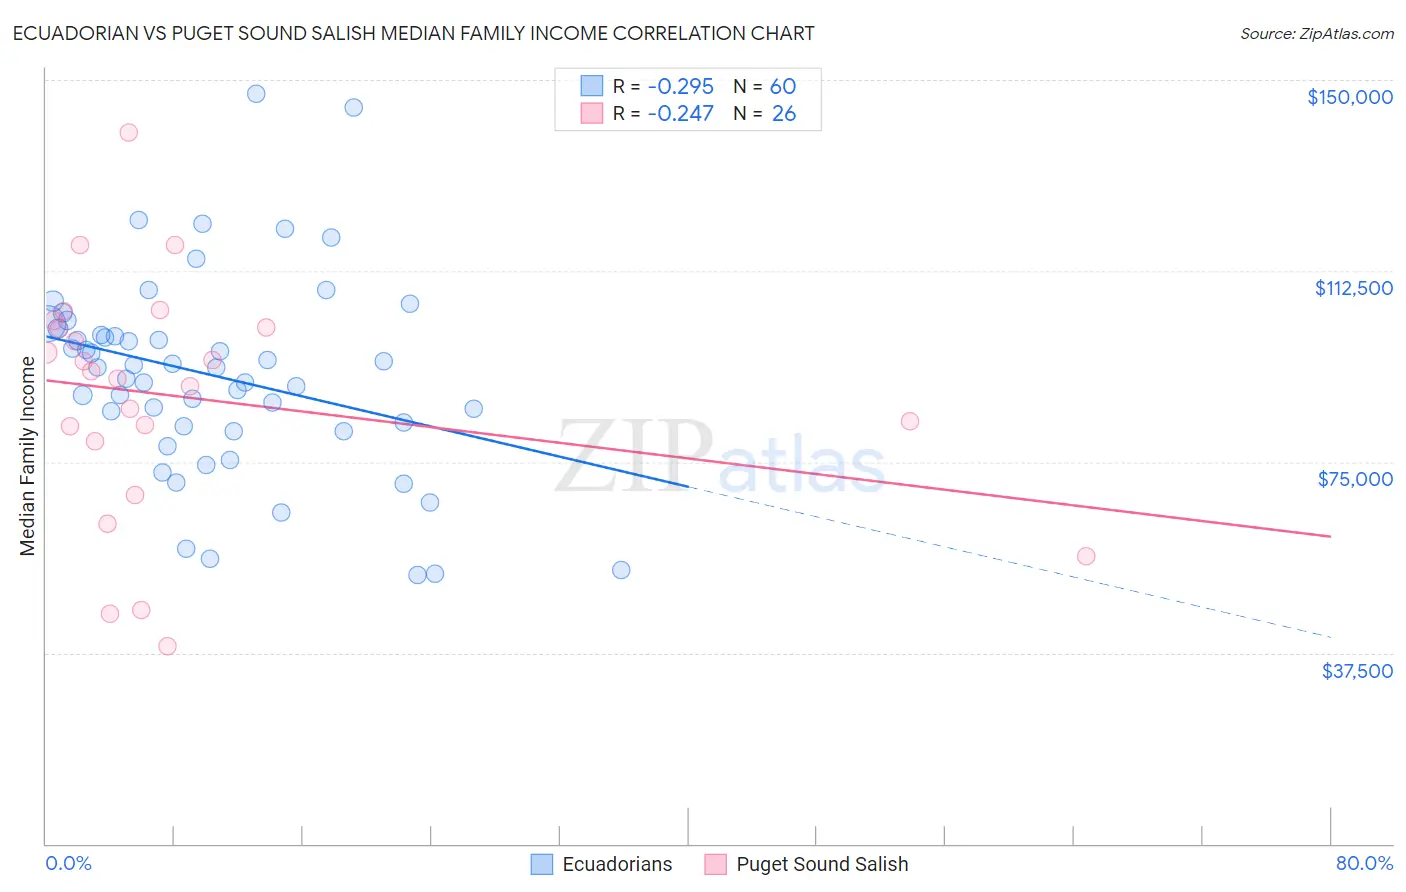
Ecuadorian vs Puget Sound Salish Median Family Income Correlation Chart
The statistical analysis conducted on geographies consisting of 317,539,775 people shows a weak negative correlation between the proportion of Ecuadorians and median family income in the United States with a correlation coefficient (R) of -0.295 and weighted average of $95,114. Similarly, the statistical analysis conducted on geographies consisting of 46,154,605 people shows a weak negative correlation between the proportion of Puget Sound Salish and median family income in the United States with a correlation coefficient (R) of -0.247 and weighted average of $97,958, a difference of 3.0%.
Median Family Income Correlation Summary
| Measurement | Ecuadorian | Puget Sound Salish |
| Minimum | $52,846 | $38,786 |
| Maximum | $147,371 | $139,583 |
| Range | $94,525 | $100,797 |
| Mean | $91,870 | $87,625 |
| Median | $93,530 | $92,122 |
| Interquartile 25% (IQ1) | $81,441 | $79,101 |
| Interquartile 75% (IQ3) | $100,588 | $101,382 |
| Interquartile Range (IQR) | $19,147 | $22,281 |
| Standard Deviation (Sample) | $19,583 | $23,723 |
| Standard Deviation (Population) | $19,420 | $23,263 |
Similar Demographics by Median Family Income
Demographics Similar to Ecuadorians by Median Family Income
In terms of median family income, the demographic groups most similar to Ecuadorians are Malaysian ($95,230, a difference of 0.12%), Marshallese ($95,293, a difference of 0.19%), Immigrants from Venezuela ($94,904, a difference of 0.22%), Immigrants from the Azores ($95,402, a difference of 0.30%), and Immigrants from Bangladesh ($94,665, a difference of 0.47%).
| Demographics | Rating | Rank | Median Family Income |
| Immigrants | Nonimmigrants | 3.6 /100 | #224 | Tragic $96,231 |
| Vietnamese | 3.4 /100 | #225 | Tragic $96,123 |
| Immigrants | Panama | 2.7 /100 | #226 | Tragic $95,647 |
| Alaska Natives | 2.6 /100 | #227 | Tragic $95,573 |
| Immigrants | Azores | 2.4 /100 | #228 | Tragic $95,402 |
| Marshallese | 2.2 /100 | #229 | Tragic $95,293 |
| Malaysians | 2.2 /100 | #230 | Tragic $95,230 |
| Ecuadorians | 2.1 /100 | #231 | Tragic $95,114 |
| Immigrants | Venezuela | 1.9 /100 | #232 | Tragic $94,904 |
| Immigrants | Bangladesh | 1.6 /100 | #233 | Tragic $94,665 |
| Immigrants | Western Africa | 1.6 /100 | #234 | Tragic $94,638 |
| Immigrants | Burma/Myanmar | 1.5 /100 | #235 | Tragic $94,472 |
| Trinidadians and Tobagonians | 1.5 /100 | #236 | Tragic $94,466 |
| Alaskan Athabascans | 1.5 /100 | #237 | Tragic $94,429 |
| Nepalese | 1.3 /100 | #238 | Tragic $94,153 |
Demographics Similar to Puget Sound Salish by Median Family Income
In terms of median family income, the demographic groups most similar to Puget Sound Salish are Immigrants from Colombia ($98,067, a difference of 0.11%), Immigrants from Sudan ($97,737, a difference of 0.23%), Immigrants from Uruguay ($98,205, a difference of 0.25%), Panamanian ($97,683, a difference of 0.28%), and Immigrants from Armenia ($97,605, a difference of 0.36%).
| Demographics | Rating | Rank | Median Family Income |
| Scotch-Irish | 17.1 /100 | #203 | Poor $99,591 |
| Ghanaians | 12.6 /100 | #204 | Poor $98,877 |
| Hawaiians | 12.5 /100 | #205 | Poor $98,869 |
| Immigrants | Iraq | 12.1 /100 | #206 | Poor $98,786 |
| Aleuts | 11.6 /100 | #207 | Poor $98,702 |
| Immigrants | Uruguay | 9.2 /100 | #208 | Tragic $98,205 |
| Immigrants | Colombia | 8.7 /100 | #209 | Tragic $98,067 |
| Puget Sound Salish | 8.2 /100 | #210 | Tragic $97,958 |
| Immigrants | Sudan | 7.4 /100 | #211 | Tragic $97,737 |
| Panamanians | 7.2 /100 | #212 | Tragic $97,683 |
| Immigrants | Armenia | 7.0 /100 | #213 | Tragic $97,605 |
| Bermudans | 6.9 /100 | #214 | Tragic $97,577 |
| Nigerians | 6.7 /100 | #215 | Tragic $97,522 |
| Immigrants | Bosnia and Herzegovina | 6.4 /100 | #216 | Tragic $97,432 |
| Japanese | 6.0 /100 | #217 | Tragic $97,288 |