Inupiat vs Puget Sound Salish Family Poverty

COMPARE

Inupiat
Race
Ancestry
AfghanAfricanAlaska NativeAlaskan AthabascanAlbanianAleutAlsatianAmericanApacheArabArapahoArgentineanArmenianAssyrian/Chaldean/SyriacAustralianAustrianBahamianBangladeshiBarbadianBasqueBelgianBelizeanBermudanBhutaneseBlackfeetBolivianBrazilianBritishBritish West IndianBulgarianBurmeseCajunCambodianCanadianCape VerdeanCarpatho RusynCelticCentral AmericanCentral American IndianCherokeeCheyenneChickasawChileanChineseChippewaChoctawColombianColvilleComancheCosta RicanCreeCreekCroatianCrowCubanCypriotCzechCzechoslovakianDanishDelawareDominicanDutchDutch West IndianEastern EuropeanEcuadorianEgyptianEnglishEstonianEthiopianEuropeanFijianFilipinoFinnishFrenchFrench American IndianFrench CanadianGermanGerman RussianGhanaianGreekGuamanian/ChamorroGuatemalanGuyaneseHaitianHmongHonduranHopiHoumaHungarianIcelanderIndian (Asian)IndonesianInupiatIranianIraqiIrishIroquoisIsraeliItalianJamaicanJapaneseJordanianKenyanKiowaKoreanLaotianLatvianLebaneseLiberianLithuanianLumbeeLuxembourgerMacedonianMalaysianMalteseMarshalleseMenomineeMexicanMexican American IndianMongolianMoroccanNative HawaiianNavajoNepaleseNew ZealanderNicaraguanNigerianNorthern EuropeanNorwegianOkinawanOsageOttawaPaiutePakistaniPalestinianPanamanianParaguayanPennsylvania GermanPeruvianPimaPolishPortuguesePotawatomiPuebloPuerto RicanRomanianRussianSalvadoranSamoanScandinavianScotch-IrishScottishSeminoleSenegaleseSerbianShoshoneSierra LeoneanSiouxSlavicSlovakSloveneSomaliSouth AfricanSouth AmericanSouth American IndianSoviet UnionSpaniardSpanishSpanish AmericanSpanish American IndianSri LankanSubsaharan AfricanSudaneseSwedishSwissSyrianTaiwaneseThaiTlingit-HaidaTohono O'OdhamTonganTrinidadian and TobagonianTsimshianTurkishU.S. Virgin IslanderUgandanUkrainianUruguayanUteVenezuelanVietnameseWelshWest IndianYakamaYaquiYugoslavianYumanYup'ikZimbabwean
Immigration
NonimmigrantsImmigrantsAfghanistanAfricaAlbaniaArgentinaArmeniaAsiaAustraliaAustriaBahamasBangladeshBarbadosBelarusBelgiumBelizeBoliviaBosnia and HerzegovinaBrazilBulgariaBurma/MyanmarCabo VerdeCambodiaCameroonCanadaCaribbeanCentral AmericaChileChinaColombiaCongoCosta RicaCroatiaCubaCzechoslovakiaDenmarkDominicaDominican RepublicEastern AfricaEastern AsiaEastern EuropeEcuadorEgyptEl SalvadorEnglandEritreaEthiopiaEuropeFijiFranceGermanyGhanaGreeceGrenadaGuatemalaGuyanaHaitiHondurasHong KongHungaryIndiaIndonesiaIranIraqIrelandIsraelItalyJamaicaJapanJordanKazakhstanKenyaKoreaKuwaitLaosLatin AmericaLatviaLebanonLiberiaLithuaniaMalaysiaMexicoMicronesiaMiddle AfricaMoldovaMoroccoNepalNetherlandsNicaraguaNigeriaNorth AmericaNorth MacedoniaNorthern AfricaNorthern EuropeNorwayOceaniaPakistanPanamaPeruPhilippinesPolandPortugalRomaniaRussiaSaudi ArabiaScotlandSenegalSerbiaSierra LeoneSingaporeSomaliaSouth AfricaSouth AmericaSouth Central AsiaSouth Eastern AsiaSouthern EuropeSpainSri LankaSt. Vincent and the GrenadinesSudanSwedenSwitzerlandSyriaTaiwanThailandTrinidad and TobagoTurkeyUgandaUkraineUruguayUzbekistanVenezuelaVietnamWest IndiesWestern AfricaWestern AsiaWestern EuropeYemenZaireZimbabweAzores
Puget Sound Salish
Race
Ancestry
AfghanAfricanAlaska NativeAlaskan AthabascanAlbanianAleutAlsatianAmericanApacheArabArapahoArgentineanArmenianAssyrian/Chaldean/SyriacAustralianAustrianBahamianBangladeshiBarbadianBasqueBelgianBelizeanBermudanBhutaneseBlackfeetBolivianBrazilianBritishBritish West IndianBulgarianBurmeseCajunCambodianCanadianCape VerdeanCarpatho RusynCelticCentral AmericanCentral American IndianCherokeeCheyenneChickasawChileanChineseChippewaChoctawColombianColvilleComancheCosta RicanCreeCreekCroatianCrowCubanCypriotCzechCzechoslovakianDanishDelawareDominicanDutchDutch West IndianEastern EuropeanEcuadorianEgyptianEnglishEstonianEthiopianEuropeanFijianFilipinoFinnishFrenchFrench American IndianFrench CanadianGermanGerman RussianGhanaianGreekGuamanian/ChamorroGuatemalanGuyaneseHaitianHmongHonduranHopiHoumaHungarianIcelanderIndian (Asian)IndonesianIranianIraqiIrishIroquoisIsraeliItalianJamaicanJapaneseJordanianKenyanKiowaKoreanLaotianLatvianLebaneseLiberianLithuanianLumbeeLuxembourgerMacedonianMalaysianMalteseMarshalleseMenomineeMexicanMexican American IndianMongolianMoroccanNative HawaiianNavajoNepaleseNew ZealanderNicaraguanNigerianNorthern EuropeanNorwegianOkinawanOsageOttawaPaiutePakistaniPalestinianPanamanianParaguayanPennsylvania GermanPeruvianPimaPolishPortuguesePotawatomiPuebloPuerto RicanPuget Sound SalishRomanianRussianSalvadoranSamoanScandinavianScotch-IrishScottishSeminoleSenegaleseSerbianShoshoneSierra LeoneanSiouxSlavicSlovakSloveneSomaliSouth AfricanSouth AmericanSouth American IndianSoviet UnionSpaniardSpanishSpanish AmericanSpanish American IndianSri LankanSubsaharan AfricanSudaneseSwedishSwissSyrianTaiwaneseThaiTlingit-HaidaTohono O'OdhamTonganTrinidadian and TobagonianTsimshianTurkishU.S. Virgin IslanderUgandanUkrainianUruguayanUteVenezuelanVietnameseWelshWest IndianYakamaYaquiYugoslavianYumanYup'ikZimbabwean
Immigration
NonimmigrantsImmigrantsAfghanistanAfricaAlbaniaArgentinaArmeniaAsiaAustraliaAustriaBahamasBangladeshBarbadosBelarusBelgiumBelizeBoliviaBosnia and HerzegovinaBrazilBulgariaBurma/MyanmarCabo VerdeCambodiaCameroonCanadaCaribbeanCentral AmericaChileChinaColombiaCongoCosta RicaCroatiaCubaCzechoslovakiaDenmarkDominicaDominican RepublicEastern AfricaEastern AsiaEastern EuropeEcuadorEgyptEl SalvadorEnglandEritreaEthiopiaEuropeFijiFranceGermanyGhanaGreeceGrenadaGuatemalaGuyanaHaitiHondurasHong KongHungaryIndiaIndonesiaIranIraqIrelandIsraelItalyJamaicaJapanJordanKazakhstanKenyaKoreaKuwaitLaosLatin AmericaLatviaLebanonLiberiaLithuaniaMalaysiaMexicoMicronesiaMiddle AfricaMoldovaMoroccoNepalNetherlandsNicaraguaNigeriaNorth AmericaNorth MacedoniaNorthern AfricaNorthern EuropeNorwayOceaniaPakistanPanamaPeruPhilippinesPolandPortugalRomaniaRussiaSaudi ArabiaScotlandSenegalSerbiaSierra LeoneSingaporeSomaliaSouth AfricaSouth AmericaSouth Central AsiaSouth Eastern AsiaSouthern EuropeSpainSri LankaSt. Vincent and the GrenadinesSudanSwedenSwitzerlandSyriaTaiwanThailandTrinidad and TobagoTurkeyUgandaUkraineUruguayUzbekistanVenezuelaVietnamWest IndiesWestern AfricaWestern AsiaWestern EuropeYemenZaireZimbabweAzores
Family Poverty
Income
Poverty
Unemployment
Labor Participation
Family Structure
Vehicle Availability
Education Level
Disability

Family Poverty Comparison

Inupiat

Puget Sound Salish

Tragic
Excellent
12.5%
FAMILY POVERTY
0.0/ 100
METRIC RATING
320th/ 347
METRIC RANK
8.4%
FAMILY POVERTY
88.6/ 100
METRIC RATING
131st/ 347
METRIC RANK

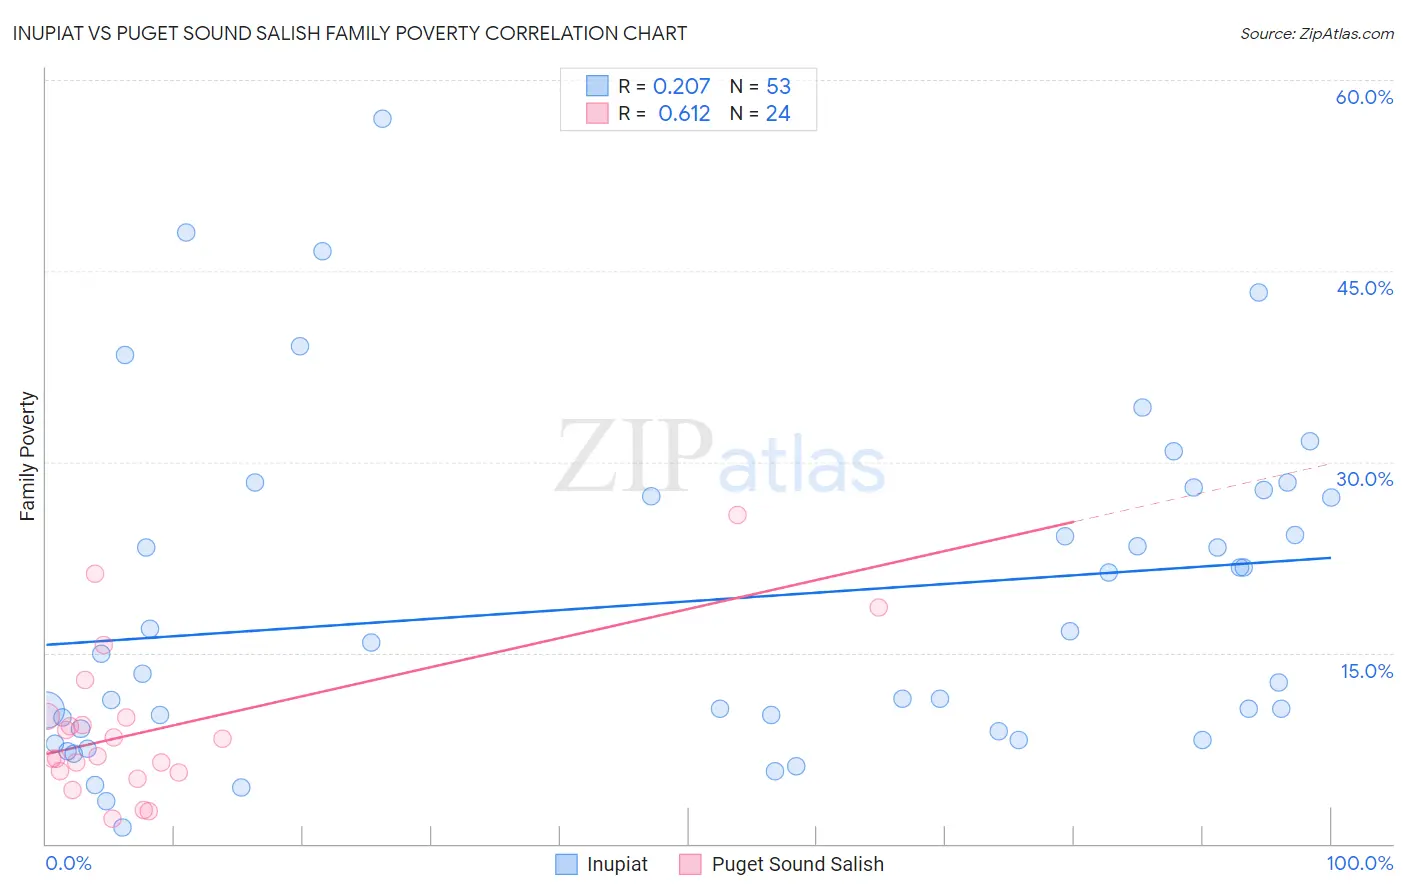
Inupiat vs Puget Sound Salish Family Poverty Correlation Chart

The statistical analysis conducted on geographies consisting of 96,272,852 people shows a weak positive correlation between the proportion of Inupiat and poverty level among families in the United States with a correlation coefficient (R) of 0.207 and weighted average of 12.5%. Similarly, the statistical analysis conducted on geographies consisting of 46,127,030 people shows a significant positive correlation between the proportion of Puget Sound Salish and poverty level among families in the United States with a correlation coefficient (R) of 0.612 and weighted average of 8.4%, a difference of 48.3%.
Inupiat vs Puget Sound Salish Family Poverty

Family Poverty Correlation Summary

MeasurementInupiatPuget Sound Salish
Minimum1.3%2.0%
Maximum56.9%25.9%
Range55.6%23.9%
Mean19.0%9.1%
Median14.9%7.6%
Interquartile 25% (IQ1)8.9%5.7%
Interquartile 75% (IQ3)27.5%9.9%
Interquartile Range (IQR)18.6%4.3%
Standard Deviation (Sample)12.9%5.9%
Standard Deviation (Population)12.8%5.8%

Similar Demographics by Family Poverty

Demographics Similar to Inupiat by Family Poverty

In terms of family poverty, the demographic groups most similar to Inupiat are British West Indian (12.4%, a difference of 0.48%), U.S. Virgin Islander (12.4%, a difference of 0.53%), Immigrants from Grenada (12.4%, a difference of 0.54%), Honduran (12.4%, a difference of 0.76%), and Immigrants from Mexico (12.3%, a difference of 1.5%).
DemographicsRating | RankFamily Poverty
Immigrants | Caribbean
0.0
/100
|
#313
Tragic
12.2%
Kiowa
0.0
/100
|
#314
Tragic
12.2%
Immigrants | Mexico
0.0
/100
|
#315
Tragic
12.3%
Hondurans
0.0
/100
|
#316
Tragic
12.4%
Immigrants | Grenada
0.0
/100
|
#317
Tragic
12.4%
U.S. Virgin Islanders
0.0
/100
|
#318
Tragic
12.4%
British West Indians
0.0
/100
|
#319
Tragic
12.4%
Inupiat
0.0
/100
|
#320
Tragic
12.5%
Arapaho
0.0
/100
|
#321
Tragic
12.7%
Immigrants | Honduras
0.0
/100
|
#322
Tragic
12.7%
Menominee
0.0
/100
|
#323
Tragic
12.7%
Immigrants | Dominica
0.0
/100
|
#324
Tragic
12.7%
Paiute
0.0
/100
|
#325
Tragic
13.0%
Colville
0.0
/100
|
#326
Tragic
13.0%
Yakama
0.0
/100
|
#327
Tragic
13.1%

Demographics Similar to Puget Sound Salish by Family Poverty

In terms of family poverty, the demographic groups most similar to Puget Sound Salish are Immigrants from Bosnia and Herzegovina (8.4%, a difference of 0.010%), Immigrants from Argentina (8.4%, a difference of 0.15%), Portuguese (8.4%, a difference of 0.19%), Argentinean (8.4%, a difference of 0.35%), and Immigrants from Hungary (8.4%, a difference of 0.49%).
DemographicsRating | RankFamily Poverty
Soviet Union
90.8
/100
|
#124
Exceptional
8.3%
Pakistanis
90.8
/100
|
#125
Exceptional
8.3%
Icelanders
90.3
/100
|
#126
Exceptional
8.3%
Immigrants | Hungary
89.9
/100
|
#127
Excellent
8.4%
Argentineans
89.6
/100
|
#128
Excellent
8.4%
Portuguese
89.2
/100
|
#129
Excellent
8.4%
Immigrants | Bosnia and Herzegovina
88.6
/100
|
#130
Excellent
8.4%
Puget Sound Salish
88.6
/100
|
#131
Excellent
8.4%
Immigrants | Argentina
88.2
/100
|
#132
Excellent
8.4%
Sri Lankans
86.6
/100
|
#133
Excellent
8.5%
Chileans
86.6
/100
|
#134
Excellent
8.5%
Immigrants | Malaysia
86.5
/100
|
#135
Excellent
8.5%
Immigrants | Brazil
86.3
/100
|
#136
Excellent
8.5%
Immigrants | Southern Europe
86.0
/100
|
#137
Excellent
8.5%
Armenians
84.6
/100
|
#138
Excellent
8.5%