Czech vs Puget Sound Salish Family Poverty
COMPARE
Czech
Puget Sound Salish
Family Poverty
Family Poverty Comparison
Czechs
Puget Sound Salish
7.4%
FAMILY POVERTY
99.6/ 100
METRIC RATING
31st/ 347
METRIC RANK
8.4%
FAMILY POVERTY
88.6/ 100
METRIC RATING
131st/ 347
METRIC RANK
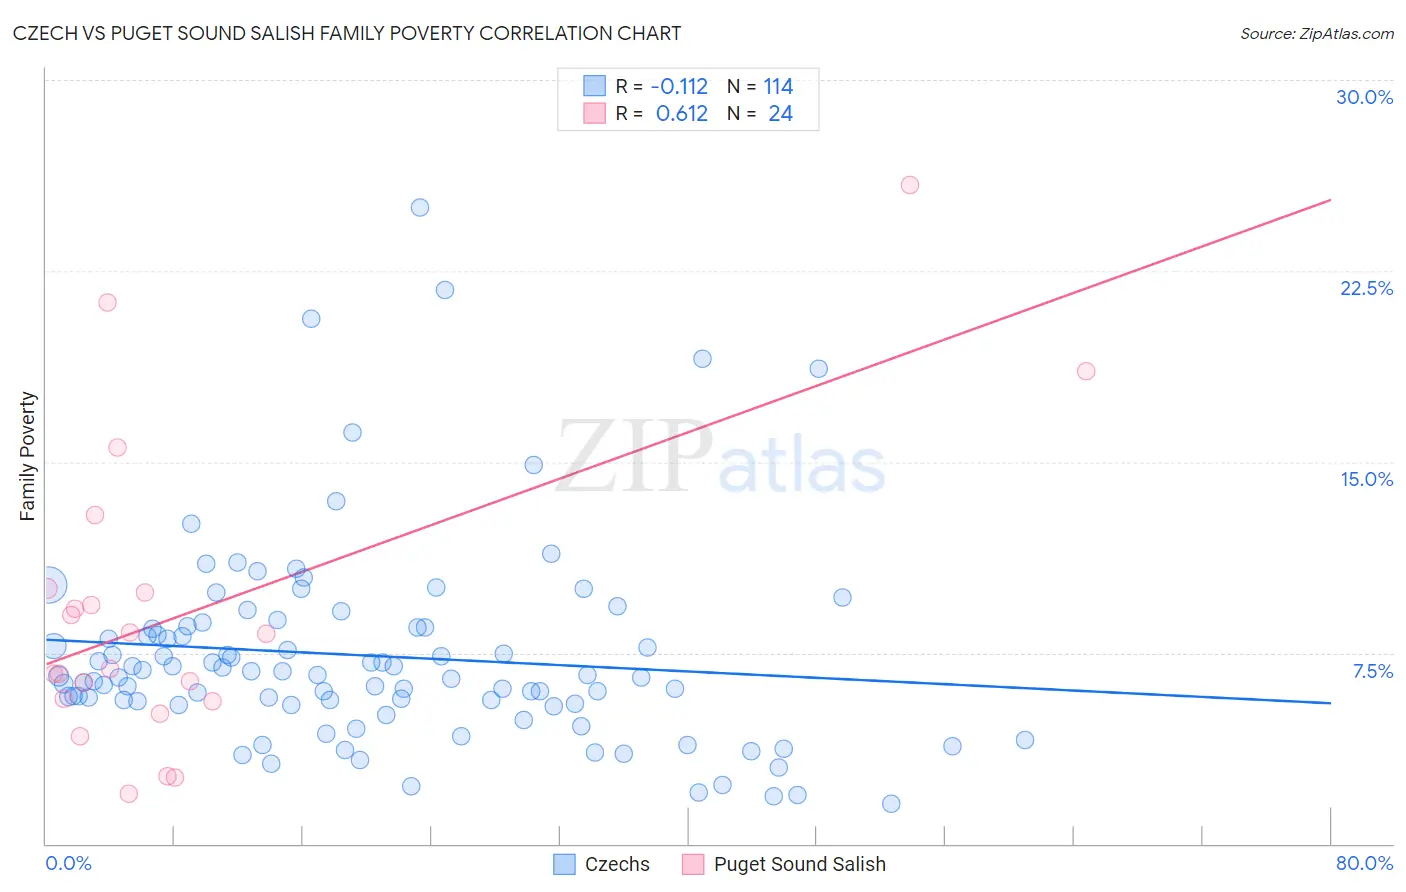
Czech vs Puget Sound Salish Family Poverty Correlation Chart
The statistical analysis conducted on geographies consisting of 482,390,324 people shows a poor negative correlation between the proportion of Czechs and poverty level among families in the United States with a correlation coefficient (R) of -0.112 and weighted average of 7.4%. Similarly, the statistical analysis conducted on geographies consisting of 46,127,030 people shows a significant positive correlation between the proportion of Puget Sound Salish and poverty level among families in the United States with a correlation coefficient (R) of 0.612 and weighted average of 8.4%, a difference of 13.3%.
Family Poverty Correlation Summary
| Measurement | Czech | Puget Sound Salish |
| Minimum | 1.6% | 2.0% |
| Maximum | 25.0% | 25.9% |
| Range | 23.4% | 23.9% |
| Mean | 7.4% | 9.1% |
| Median | 6.6% | 7.6% |
| Interquartile 25% (IQ1) | 5.5% | 5.7% |
| Interquartile 75% (IQ3) | 8.5% | 9.9% |
| Interquartile Range (IQR) | 3.0% | 4.3% |
| Standard Deviation (Sample) | 4.0% | 5.9% |
| Standard Deviation (Population) | 3.9% | 5.8% |
Similar Demographics by Family Poverty
Demographics Similar to Czechs by Family Poverty
In terms of family poverty, the demographic groups most similar to Czechs are Italian (7.4%, a difference of 0.12%), Polish (7.4%, a difference of 0.30%), Immigrants from Japan (7.4%, a difference of 0.30%), Immigrants from Northern Europe (7.4%, a difference of 0.41%), and Russian (7.5%, a difference of 0.53%).
| Demographics | Rating | Rank | Family Poverty |
| Croatians | 99.7 /100 | #24 | Exceptional 7.3% |
| Burmese | 99.7 /100 | #25 | Exceptional 7.3% |
| Cypriots | 99.6 /100 | #26 | Exceptional 7.3% |
| Immigrants | Scotland | 99.6 /100 | #27 | Exceptional 7.3% |
| Immigrants | Korea | 99.6 /100 | #28 | Exceptional 7.4% |
| Immigrants | Northern Europe | 99.6 /100 | #29 | Exceptional 7.4% |
| Italians | 99.6 /100 | #30 | Exceptional 7.4% |
| Czechs | 99.6 /100 | #31 | Exceptional 7.4% |
| Poles | 99.5 /100 | #32 | Exceptional 7.4% |
| Immigrants | Japan | 99.5 /100 | #33 | Exceptional 7.4% |
| Russians | 99.5 /100 | #34 | Exceptional 7.5% |
| Greeks | 99.4 /100 | #35 | Exceptional 7.5% |
| Turks | 99.4 /100 | #36 | Exceptional 7.5% |
| Estonians | 99.4 /100 | #37 | Exceptional 7.5% |
| Bolivians | 99.3 /100 | #38 | Exceptional 7.5% |
Demographics Similar to Puget Sound Salish by Family Poverty
In terms of family poverty, the demographic groups most similar to Puget Sound Salish are Immigrants from Bosnia and Herzegovina (8.4%, a difference of 0.010%), Immigrants from Argentina (8.4%, a difference of 0.15%), Portuguese (8.4%, a difference of 0.19%), Argentinean (8.4%, a difference of 0.35%), and Immigrants from Hungary (8.4%, a difference of 0.49%).
| Demographics | Rating | Rank | Family Poverty |
| Soviet Union | 90.8 /100 | #124 | Exceptional 8.3% |
| Pakistanis | 90.8 /100 | #125 | Exceptional 8.3% |
| Icelanders | 90.3 /100 | #126 | Exceptional 8.3% |
| Immigrants | Hungary | 89.9 /100 | #127 | Excellent 8.4% |
| Argentineans | 89.6 /100 | #128 | Excellent 8.4% |
| Portuguese | 89.2 /100 | #129 | Excellent 8.4% |
| Immigrants | Bosnia and Herzegovina | 88.6 /100 | #130 | Excellent 8.4% |
| Puget Sound Salish | 88.6 /100 | #131 | Excellent 8.4% |
| Immigrants | Argentina | 88.2 /100 | #132 | Excellent 8.4% |
| Sri Lankans | 86.6 /100 | #133 | Excellent 8.5% |
| Chileans | 86.6 /100 | #134 | Excellent 8.5% |
| Immigrants | Malaysia | 86.5 /100 | #135 | Excellent 8.5% |
| Immigrants | Brazil | 86.3 /100 | #136 | Excellent 8.5% |
| Immigrants | Southern Europe | 86.0 /100 | #137 | Excellent 8.5% |
| Armenians | 84.6 /100 | #138 | Excellent 8.5% |