Somali vs Chilean Single Female Poverty
COMPARE
Somali
Chilean
Single Female Poverty
Single Female Poverty Comparison
Somalis
Chileans
25.2%
SINGLE FEMALE POVERTY
0.0/ 100
METRIC RATING
303rd/ 347
METRIC RANK
19.9%
SINGLE FEMALE POVERTY
96.9/ 100
METRIC RATING
104th/ 347
METRIC RANK
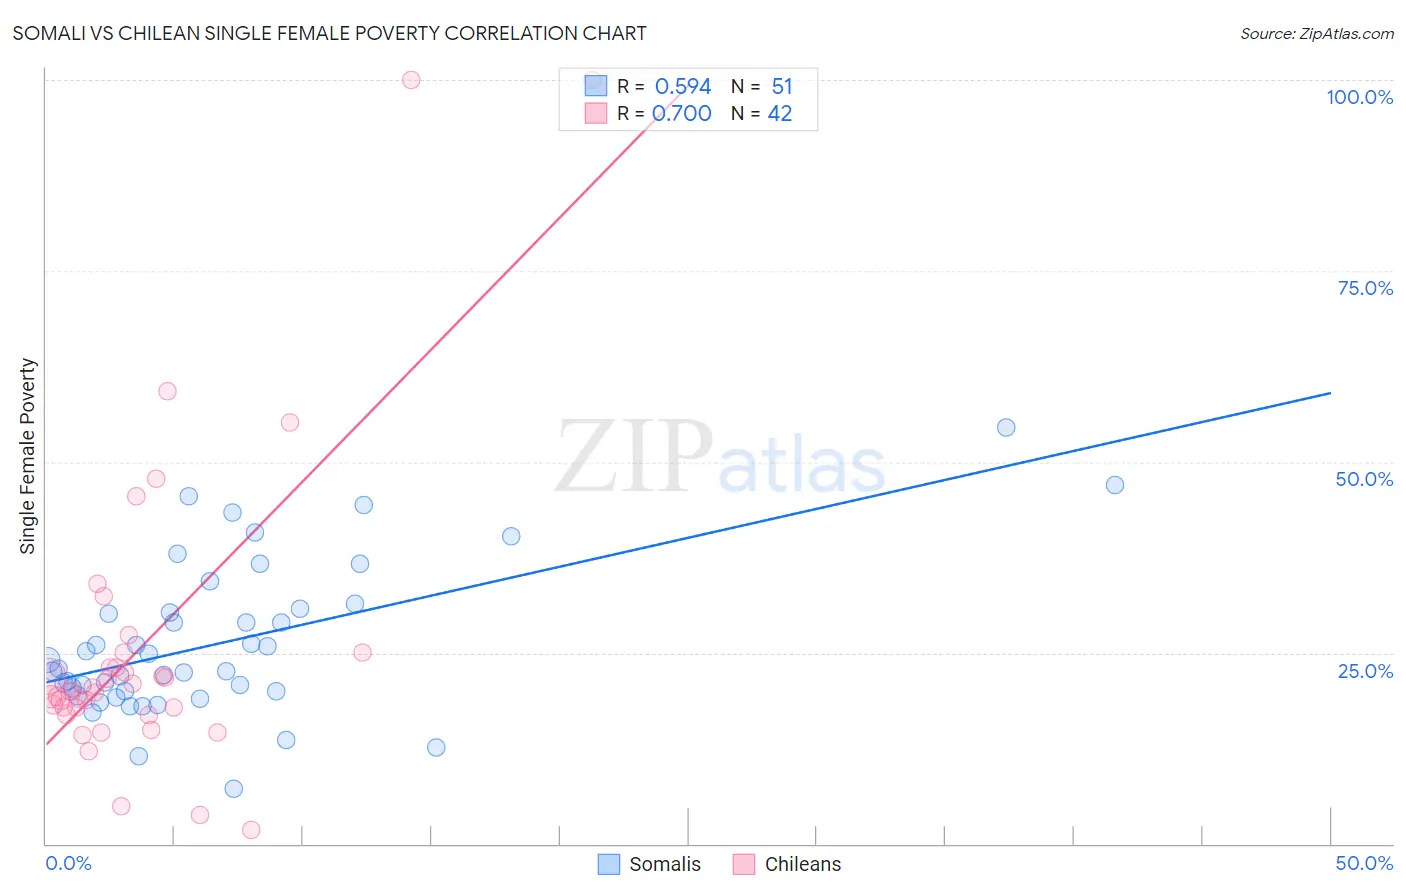
Somali vs Chilean Single Female Poverty Correlation Chart
The statistical analysis conducted on geographies consisting of 99,025,014 people shows a substantial positive correlation between the proportion of Somalis and poverty level among single females in the United States with a correlation coefficient (R) of 0.594 and weighted average of 25.2%. Similarly, the statistical analysis conducted on geographies consisting of 254,415,237 people shows a strong positive correlation between the proportion of Chileans and poverty level among single females in the United States with a correlation coefficient (R) of 0.700 and weighted average of 19.9%, a difference of 26.9%.
Single Female Poverty Correlation Summary
| Measurement | Somali | Chilean |
| Minimum | 7.2% | 1.8% |
| Maximum | 54.5% | 100.0% |
| Range | 47.2% | 98.2% |
| Mean | 26.3% | 25.9% |
| Median | 23.0% | 19.9% |
| Interquartile 25% (IQ1) | 19.9% | 17.8% |
| Interquartile 75% (IQ3) | 30.8% | 25.0% |
| Interquartile Range (IQR) | 10.9% | 7.2% |
| Standard Deviation (Sample) | 9.9% | 20.4% |
| Standard Deviation (Population) | 9.8% | 20.1% |
Similar Demographics by Single Female Poverty
Demographics Similar to Somalis by Single Female Poverty
In terms of single female poverty, the demographic groups most similar to Somalis are Immigrants from Congo (25.3%, a difference of 0.27%), Immigrants from Dominican Republic (25.3%, a difference of 0.28%), Immigrants from Mexico (25.3%, a difference of 0.38%), Shoshone (25.1%, a difference of 0.40%), and Honduran (25.1%, a difference of 0.48%).
| Demographics | Rating | Rank | Single Female Poverty |
| Africans | 0.0 /100 | #296 | Tragic 24.8% |
| Immigrants | Central America | 0.0 /100 | #297 | Tragic 24.8% |
| Yaqui | 0.0 /100 | #298 | Tragic 24.9% |
| Mexicans | 0.0 /100 | #299 | Tragic 25.0% |
| Blackfeet | 0.0 /100 | #300 | Tragic 25.1% |
| Hondurans | 0.0 /100 | #301 | Tragic 25.1% |
| Shoshone | 0.0 /100 | #302 | Tragic 25.1% |
| Somalis | 0.0 /100 | #303 | Tragic 25.2% |
| Immigrants | Congo | 0.0 /100 | #304 | Tragic 25.3% |
| Immigrants | Dominican Republic | 0.0 /100 | #305 | Tragic 25.3% |
| Immigrants | Mexico | 0.0 /100 | #306 | Tragic 25.3% |
| Potawatomi | 0.0 /100 | #307 | Tragic 25.4% |
| Aleuts | 0.0 /100 | #308 | Tragic 25.4% |
| Dominicans | 0.0 /100 | #309 | Tragic 25.4% |
| Central American Indians | 0.0 /100 | #310 | Tragic 25.5% |
Demographics Similar to Chileans by Single Female Poverty
In terms of single female poverty, the demographic groups most similar to Chileans are Israeli (19.9%, a difference of 0.010%), Ethiopian (19.9%, a difference of 0.10%), Immigrants from Southern Europe (19.9%, a difference of 0.12%), Immigrants from Syria (19.9%, a difference of 0.12%), and Native Hawaiian (19.9%, a difference of 0.17%).
| Demographics | Rating | Rank | Single Female Poverty |
| Croatians | 98.1 /100 | #97 | Exceptional 19.7% |
| Immigrants | France | 97.9 /100 | #98 | Exceptional 19.7% |
| Sierra Leoneans | 97.9 /100 | #99 | Exceptional 19.7% |
| Ukrainians | 97.6 /100 | #100 | Exceptional 19.8% |
| Immigrants | Belgium | 97.3 /100 | #101 | Exceptional 19.8% |
| Immigrants | Cameroon | 97.3 /100 | #102 | Exceptional 19.8% |
| Immigrants | Southern Europe | 97.1 /100 | #103 | Exceptional 19.9% |
| Chileans | 96.9 /100 | #104 | Exceptional 19.9% |
| Israelis | 96.9 /100 | #105 | Exceptional 19.9% |
| Ethiopians | 96.7 /100 | #106 | Exceptional 19.9% |
| Immigrants | Syria | 96.7 /100 | #107 | Exceptional 19.9% |
| Native Hawaiians | 96.6 /100 | #108 | Exceptional 19.9% |
| Colombians | 96.6 /100 | #109 | Exceptional 19.9% |
| Immigrants | Western Asia | 96.5 /100 | #110 | Exceptional 19.9% |
| Carpatho Rusyns | 96.1 /100 | #111 | Exceptional 20.0% |