Ecuadorian vs Chilean High School Diploma
COMPARE
Ecuadorian
Chilean
High School Diploma
High School Diploma Comparison
Ecuadorians
Chileans
85.1%
HIGH SCHOOL DIPLOMA
0.0/ 100
METRIC RATING
311th/ 347
METRIC RANK
89.6%
HIGH SCHOOL DIPLOMA
79.0/ 100
METRIC RATING
141st/ 347
METRIC RANK
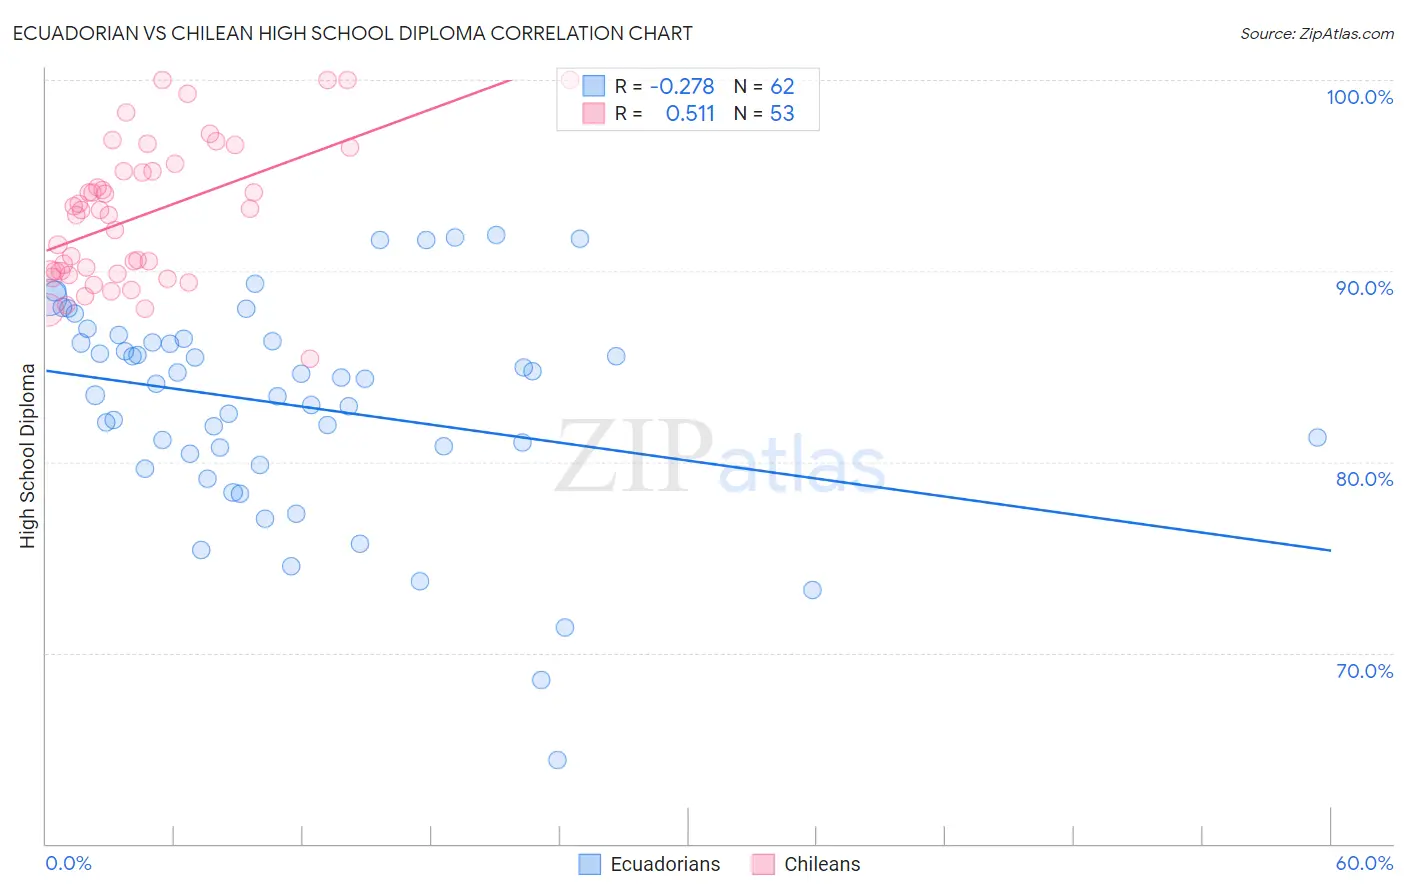
Ecuadorian vs Chilean High School Diploma Correlation Chart
The statistical analysis conducted on geographies consisting of 317,865,755 people shows a weak negative correlation between the proportion of Ecuadorians and percentage of population with at least high school diploma education in the United States with a correlation coefficient (R) of -0.278 and weighted average of 85.1%. Similarly, the statistical analysis conducted on geographies consisting of 256,681,007 people shows a substantial positive correlation between the proportion of Chileans and percentage of population with at least high school diploma education in the United States with a correlation coefficient (R) of 0.511 and weighted average of 89.6%, a difference of 5.3%.
High School Diploma Correlation Summary
| Measurement | Ecuadorian | Chilean |
| Minimum | 64.4% | 85.4% |
| Maximum | 91.9% | 100.0% |
| Range | 27.5% | 14.6% |
| Mean | 83.0% | 93.0% |
| Median | 84.2% | 93.2% |
| Interquartile 25% (IQ1) | 80.4% | 89.9% |
| Interquartile 75% (IQ3) | 86.3% | 95.4% |
| Interquartile Range (IQR) | 5.9% | 5.5% |
| Standard Deviation (Sample) | 5.7% | 3.7% |
| Standard Deviation (Population) | 5.6% | 3.6% |
Similar Demographics by High School Diploma
Demographics Similar to Ecuadorians by High School Diploma
In terms of high school diploma, the demographic groups most similar to Ecuadorians are Apache (85.1%, a difference of 0.010%), Cape Verdean (85.1%, a difference of 0.050%), Immigrants from Dominica (85.2%, a difference of 0.090%), Immigrants from Armenia (85.2%, a difference of 0.10%), and Navajo (85.2%, a difference of 0.11%).
| Demographics | Rating | Rank | High School Diploma |
| Nepalese | 0.0 /100 | #304 | Tragic 85.3% |
| Immigrants | Portugal | 0.0 /100 | #305 | Tragic 85.3% |
| Immigrants | Guyana | 0.0 /100 | #306 | Tragic 85.3% |
| Navajo | 0.0 /100 | #307 | Tragic 85.2% |
| Immigrants | Armenia | 0.0 /100 | #308 | Tragic 85.2% |
| Immigrants | Dominica | 0.0 /100 | #309 | Tragic 85.2% |
| Apache | 0.0 /100 | #310 | Tragic 85.1% |
| Ecuadorians | 0.0 /100 | #311 | Tragic 85.1% |
| Cape Verdeans | 0.0 /100 | #312 | Tragic 85.1% |
| Immigrants | Ecuador | 0.0 /100 | #313 | Tragic 84.8% |
| Yaqui | 0.0 /100 | #314 | Tragic 84.7% |
| Puerto Ricans | 0.0 /100 | #315 | Tragic 84.7% |
| Belizeans | 0.0 /100 | #316 | Tragic 84.3% |
| Immigrants | Caribbean | 0.0 /100 | #317 | Tragic 84.3% |
| Immigrants | Belize | 0.0 /100 | #318 | Tragic 84.2% |
Demographics Similar to Chileans by High School Diploma
In terms of high school diploma, the demographic groups most similar to Chileans are Indian (Asian) (89.6%, a difference of 0.0%), Pakistani (89.6%, a difference of 0.020%), Immigrants from Kenya (89.6%, a difference of 0.020%), Immigrants from Egypt (89.6%, a difference of 0.050%), and Immigrants from Brazil (89.5%, a difference of 0.050%).
| Demographics | Rating | Rank | High School Diploma |
| Immigrants | Jordan | 87.2 /100 | #134 | Excellent 89.8% |
| Chippewa | 85.6 /100 | #135 | Excellent 89.7% |
| Ugandans | 83.7 /100 | #136 | Excellent 89.7% |
| Arabs | 83.6 /100 | #137 | Excellent 89.7% |
| Assyrians/Chaldeans/Syriacs | 82.5 /100 | #138 | Excellent 89.7% |
| Kenyans | 81.4 /100 | #139 | Excellent 89.6% |
| Immigrants | Egypt | 81.2 /100 | #140 | Excellent 89.6% |
| Chileans | 79.0 /100 | #141 | Good 89.6% |
| Indians (Asian) | 78.8 /100 | #142 | Good 89.6% |
| Pakistanis | 78.3 /100 | #143 | Good 89.6% |
| Immigrants | Kenya | 78.0 /100 | #144 | Good 89.6% |
| Immigrants | Brazil | 76.6 /100 | #145 | Good 89.5% |
| Immigrants | Spain | 76.2 /100 | #146 | Good 89.5% |
| Iraqis | 73.9 /100 | #147 | Good 89.5% |
| Immigrants | Lebanon | 73.4 /100 | #148 | Good 89.5% |