Delaware vs Osage Per Capita Income
COMPARE
Delaware
Osage
Per Capita Income
Per Capita Income Comparison
Delaware
Osage
$40,778
PER CAPITA INCOME
3.8/ 100
METRIC RATING
233rd/ 347
METRIC RANK
$39,568
PER CAPITA INCOME
1.0/ 100
METRIC RATING
253rd/ 347
METRIC RANK
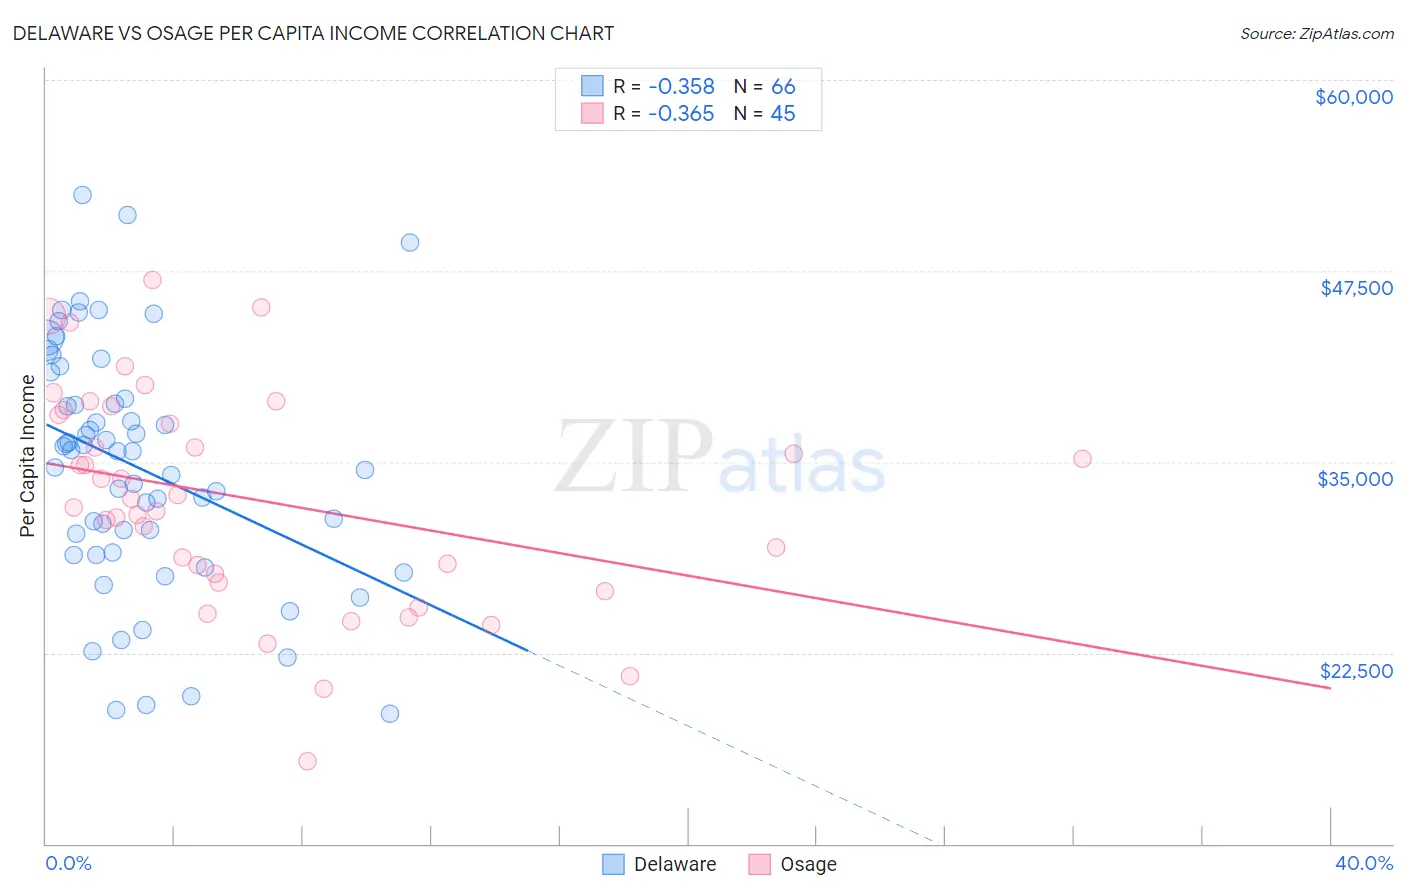
Delaware vs Osage Per Capita Income Correlation Chart
The statistical analysis conducted on geographies consisting of 96,239,490 people shows a mild negative correlation between the proportion of Delaware and per capita income in the United States with a correlation coefficient (R) of -0.358 and weighted average of $40,778. Similarly, the statistical analysis conducted on geographies consisting of 91,808,929 people shows a mild negative correlation between the proportion of Osage and per capita income in the United States with a correlation coefficient (R) of -0.365 and weighted average of $39,568, a difference of 3.1%.
Per Capita Income Correlation Summary
| Measurement | Delaware | Osage |
| Minimum | $18,507 | $15,396 |
| Maximum | $52,470 | $46,906 |
| Range | $33,963 | $31,510 |
| Mean | $34,628 | $32,578 |
| Median | $35,673 | $32,608 |
| Interquartile 25% (IQ1) | $29,044 | $27,395 |
| Interquartile 75% (IQ3) | $39,167 | $38,257 |
| Interquartile Range (IQR) | $10,124 | $10,862 |
| Standard Deviation (Sample) | $7,889 | $7,093 |
| Standard Deviation (Population) | $7,829 | $7,014 |
Demographics Similar to Delaware and Osage by Per Capita Income
In terms of per capita income, the demographic groups most similar to Delaware are Immigrants from West Indies ($40,763, a difference of 0.040%), Immigrants from Guyana ($40,742, a difference of 0.090%), Nonimmigrants ($40,669, a difference of 0.27%), Immigrants from Cambodia ($40,434, a difference of 0.85%), and Somali ($40,367, a difference of 1.0%). Similarly, the demographic groups most similar to Osage are Immigrants from the Azores ($39,608, a difference of 0.10%), Samoan ($39,826, a difference of 0.65%), Immigrants from Burma/Myanmar ($39,827, a difference of 0.66%), Japanese ($39,870, a difference of 0.76%), and Cape Verdean ($39,935, a difference of 0.93%).
| Demographics | Rating | Rank | Per Capita Income |
| Delaware | 3.8 /100 | #233 | Tragic $40,778 |
| Immigrants | West Indies | 3.7 /100 | #234 | Tragic $40,763 |
| Immigrants | Guyana | 3.6 /100 | #235 | Tragic $40,742 |
| Immigrants | Nonimmigrants | 3.4 /100 | #236 | Tragic $40,669 |
| Immigrants | Cambodia | 2.6 /100 | #237 | Tragic $40,434 |
| Somalis | 2.4 /100 | #238 | Tragic $40,367 |
| Tsimshian | 2.4 /100 | #239 | Tragic $40,344 |
| Immigrants | Nigeria | 2.3 /100 | #240 | Tragic $40,339 |
| British West Indians | 2.3 /100 | #241 | Tragic $40,330 |
| Immigrants | Western Africa | 2.2 /100 | #242 | Tragic $40,294 |
| German Russians | 2.2 /100 | #243 | Tragic $40,266 |
| French American Indians | 2.1 /100 | #244 | Tragic $40,244 |
| Sub-Saharan Africans | 1.9 /100 | #245 | Tragic $40,152 |
| Cree | 1.7 /100 | #246 | Tragic $40,056 |
| Immigrants | Somalia | 1.6 /100 | #247 | Tragic $39,974 |
| Cape Verdeans | 1.5 /100 | #248 | Tragic $39,935 |
| Japanese | 1.4 /100 | #249 | Tragic $39,870 |
| Immigrants | Burma/Myanmar | 1.3 /100 | #250 | Tragic $39,827 |
| Samoans | 1.3 /100 | #251 | Tragic $39,826 |
| Immigrants | Azores | 1.0 /100 | #252 | Tragic $39,608 |
| Osage | 1.0 /100 | #253 | Tragic $39,568 |