Delaware vs Immigrants from Somalia Single Father Poverty

COMPARE

Delaware
Race
Ancestry
AfghanAfricanAlaska NativeAlaskan AthabascanAlbanianAleutAlsatianAmericanApacheArabArapahoArgentineanArmenianAssyrian/Chaldean/SyriacAustralianAustrianBahamianBangladeshiBarbadianBasqueBelgianBelizeanBermudanBhutaneseBlackfeetBolivianBrazilianBritishBritish West IndianBulgarianBurmeseCajunCambodianCanadianCape VerdeanCarpatho RusynCelticCentral AmericanCentral American IndianCherokeeCheyenneChickasawChileanChineseChippewaChoctawColombianColvilleComancheCosta RicanCreeCreekCroatianCrowCubanCypriotCzechCzechoslovakianDanishDelawareDominicanDutchDutch West IndianEastern EuropeanEcuadorianEgyptianEnglishEstonianEthiopianEuropeanFijianFilipinoFinnishFrenchFrench American IndianFrench CanadianGermanGerman RussianGhanaianGreekGuamanian/ChamorroGuatemalanGuyaneseHaitianHmongHonduranHopiHoumaHungarianIcelanderIndian (Asian)IndonesianInupiatIranianIraqiIrishIroquoisIsraeliItalianJamaicanJapaneseJordanianKenyanKiowaKoreanLaotianLatvianLebaneseLiberianLithuanianLumbeeLuxembourgerMacedonianMalaysianMalteseMarshalleseMenomineeMexicanMexican American IndianMongolianMoroccanNative HawaiianNavajoNepaleseNew ZealanderNicaraguanNigerianNorthern EuropeanNorwegianOkinawanOsageOttawaPaiutePakistaniPalestinianPanamanianParaguayanPennsylvania GermanPeruvianPimaPolishPortuguesePotawatomiPuebloPuerto RicanPuget Sound SalishRomanianRussianSalvadoranSamoanScandinavianScotch-IrishScottishSeminoleSenegaleseSerbianShoshoneSierra LeoneanSiouxSlavicSlovakSloveneSomaliSouth AfricanSouth AmericanSouth American IndianSoviet UnionSpaniardSpanishSpanish AmericanSpanish American IndianSri LankanSubsaharan AfricanSudaneseSwedishSwissSyrianTaiwaneseThaiTlingit-HaidaTohono O'OdhamTonganTrinidadian and TobagonianTsimshianTurkishU.S. Virgin IslanderUgandanUkrainianUruguayanUteVenezuelanVietnameseWelshWest IndianYakamaYaquiYugoslavianYumanYup'ikZimbabwean
Immigration
NonimmigrantsImmigrantsAfghanistanAfricaAlbaniaArgentinaArmeniaAsiaAustraliaAustriaBahamasBangladeshBarbadosBelarusBelgiumBelizeBoliviaBosnia and HerzegovinaBrazilBulgariaBurma/MyanmarCabo VerdeCambodiaCameroonCanadaCaribbeanCentral AmericaChileChinaColombiaCongoCosta RicaCroatiaCubaCzechoslovakiaDenmarkDominicaDominican RepublicEastern AfricaEastern AsiaEastern EuropeEcuadorEgyptEl SalvadorEnglandEritreaEthiopiaEuropeFijiFranceGermanyGhanaGreeceGrenadaGuatemalaGuyanaHaitiHondurasHong KongHungaryIndiaIndonesiaIranIraqIrelandIsraelItalyJamaicaJapanJordanKazakhstanKenyaKoreaKuwaitLaosLatin AmericaLatviaLebanonLiberiaLithuaniaMalaysiaMexicoMicronesiaMiddle AfricaMoldovaMoroccoNepalNetherlandsNicaraguaNigeriaNorth AmericaNorth MacedoniaNorthern AfricaNorthern EuropeNorwayOceaniaPakistanPanamaPeruPhilippinesPolandPortugalRomaniaRussiaSaudi ArabiaScotlandSenegalSerbiaSierra LeoneSingaporeSouth AfricaSouth AmericaSouth Central AsiaSouth Eastern AsiaSouthern EuropeSpainSri LankaSt. Vincent and the GrenadinesSudanSwedenSwitzerlandSyriaTaiwanThailandTrinidad and TobagoTurkeyUgandaUkraineUruguayUzbekistanVenezuelaVietnamWest IndiesWestern AfricaWestern AsiaWestern EuropeYemenZaireZimbabweAzores
Immigrants from Somalia
Race
Ancestry
AfghanAfricanAlaska NativeAlaskan AthabascanAlbanianAleutAlsatianAmericanApacheArabArapahoArgentineanArmenianAssyrian/Chaldean/SyriacAustralianAustrianBahamianBangladeshiBarbadianBasqueBelgianBelizeanBermudanBhutaneseBlackfeetBolivianBrazilianBritishBritish West IndianBulgarianBurmeseCajunCambodianCanadianCape VerdeanCarpatho RusynCelticCentral AmericanCentral American IndianCherokeeCheyenneChickasawChileanChineseChippewaChoctawColombianColvilleComancheCosta RicanCreeCreekCroatianCrowCubanCypriotCzechCzechoslovakianDanishDominicanDutchDutch West IndianEastern EuropeanEcuadorianEgyptianEnglishEstonianEthiopianEuropeanFijianFilipinoFinnishFrenchFrench American IndianFrench CanadianGermanGerman RussianGhanaianGreekGuamanian/ChamorroGuatemalanGuyaneseHaitianHmongHonduranHopiHoumaHungarianIcelanderIndian (Asian)IndonesianInupiatIranianIraqiIrishIroquoisIsraeliItalianJamaicanJapaneseJordanianKenyanKiowaKoreanLaotianLatvianLebaneseLiberianLithuanianLumbeeLuxembourgerMacedonianMalaysianMalteseMarshalleseMenomineeMexicanMexican American IndianMongolianMoroccanNative HawaiianNavajoNepaleseNew ZealanderNicaraguanNigerianNorthern EuropeanNorwegianOkinawanOsageOttawaPaiutePakistaniPalestinianPanamanianParaguayanPennsylvania GermanPeruvianPimaPolishPortuguesePotawatomiPuebloPuerto RicanPuget Sound SalishRomanianRussianSalvadoranSamoanScandinavianScotch-IrishScottishSeminoleSenegaleseSerbianShoshoneSierra LeoneanSiouxSlavicSlovakSloveneSomaliSouth AfricanSouth AmericanSouth American IndianSoviet UnionSpaniardSpanishSpanish AmericanSpanish American IndianSri LankanSubsaharan AfricanSudaneseSwedishSwissSyrianTaiwaneseThaiTlingit-HaidaTohono O'OdhamTonganTrinidadian and TobagonianTsimshianTurkishU.S. Virgin IslanderUgandanUkrainianUruguayanUteVenezuelanVietnameseWelshWest IndianYakamaYaquiYugoslavianYumanYup'ikZimbabwean
Immigration
NonimmigrantsImmigrantsAfghanistanAfricaAlbaniaArgentinaArmeniaAsiaAustraliaAustriaBahamasBangladeshBarbadosBelarusBelgiumBelizeBoliviaBosnia and HerzegovinaBrazilBulgariaBurma/MyanmarCabo VerdeCambodiaCameroonCanadaCaribbeanCentral AmericaChileChinaColombiaCongoCosta RicaCroatiaCubaCzechoslovakiaDenmarkDominicaDominican RepublicEastern AfricaEastern AsiaEastern EuropeEcuadorEgyptEl SalvadorEnglandEritreaEthiopiaEuropeFijiFranceGermanyGhanaGreeceGrenadaGuatemalaGuyanaHaitiHondurasHong KongHungaryIndiaIndonesiaIranIraqIrelandIsraelItalyJamaicaJapanJordanKazakhstanKenyaKoreaKuwaitLaosLatin AmericaLatviaLebanonLiberiaLithuaniaMalaysiaMexicoMicronesiaMiddle AfricaMoldovaMoroccoNepalNetherlandsNicaraguaNigeriaNorth AmericaNorth MacedoniaNorthern AfricaNorthern EuropeNorwayOceaniaPakistanPanamaPeruPhilippinesPolandPortugalRomaniaRussiaSaudi ArabiaScotlandSenegalSerbiaSierra LeoneSingaporeSomaliaSouth AfricaSouth AmericaSouth Central AsiaSouth Eastern AsiaSouthern EuropeSpainSri LankaSt. Vincent and the GrenadinesSudanSwedenSwitzerlandSyriaTaiwanThailandTrinidad and TobagoTurkeyUgandaUkraineUruguayUzbekistanVenezuelaVietnamWest IndiesWestern AfricaWestern AsiaWestern EuropeYemenZaireZimbabweAzores
Single Father Poverty
Income
Poverty
Unemployment
Labor Participation
Family Structure
Vehicle Availability
Education Level
Disability

Single Father Poverty Comparison

Delaware

Immigrants from Somalia

Tragic
Exceptional
18.9%
SINGLE FATHER POVERTY
0.0/ 100
METRIC RATING
314th/ 347
METRIC RANK
14.9%
SINGLE FATHER POVERTY
100.0/ 100
METRIC RATING
45th/ 347
METRIC RANK

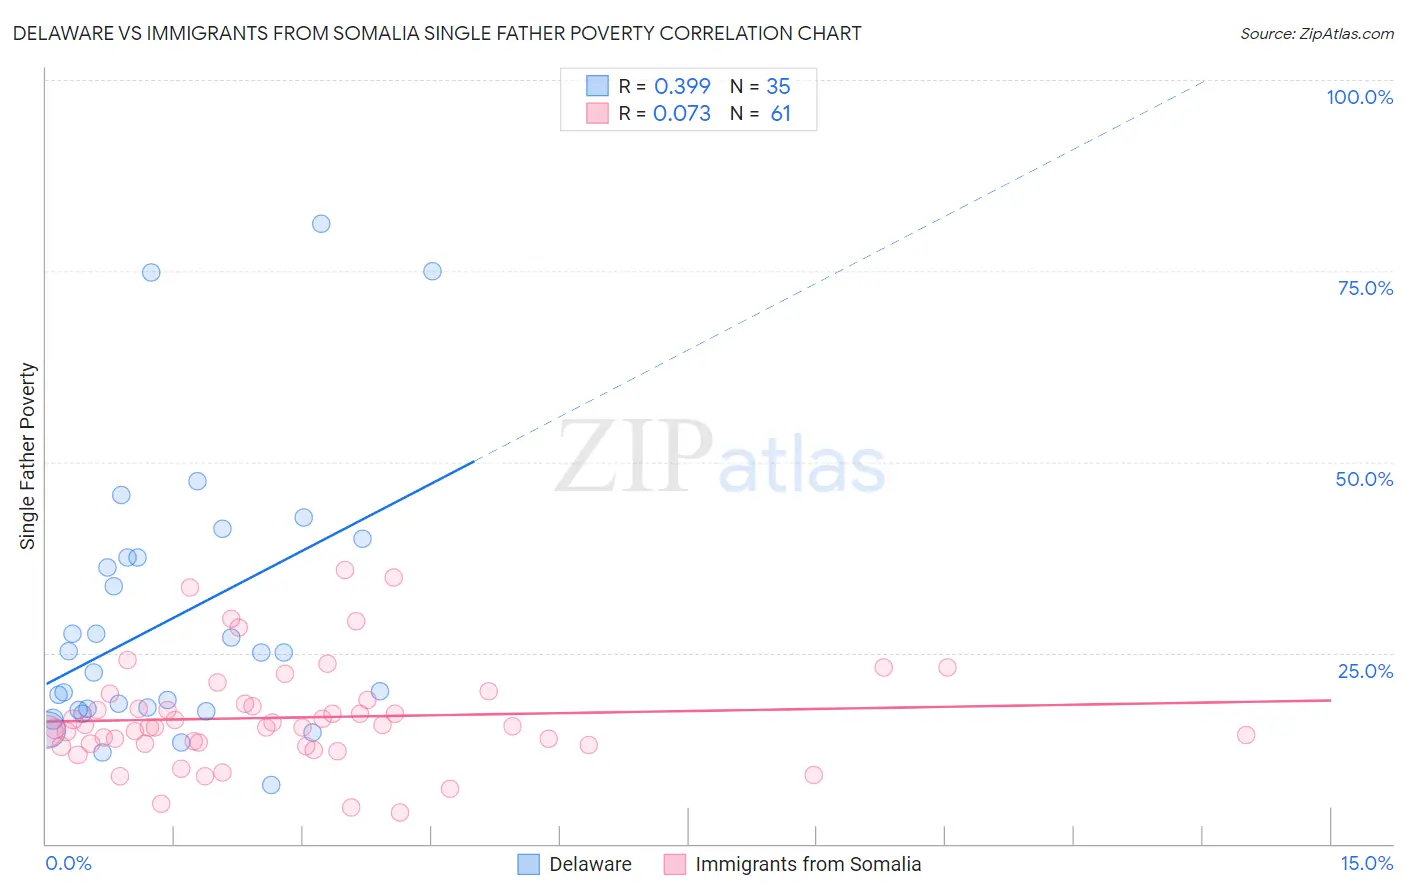
Delaware vs Immigrants from Somalia Single Father Poverty Correlation Chart

The statistical analysis conducted on geographies consisting of 86,574,131 people shows a mild positive correlation between the proportion of Delaware and poverty level among single fathers in the United States with a correlation coefficient (R) of 0.399 and weighted average of 18.9%. Similarly, the statistical analysis conducted on geographies consisting of 85,270,664 people shows a slight positive correlation between the proportion of Immigrants from Somalia and poverty level among single fathers in the United States with a correlation coefficient (R) of 0.073 and weighted average of 14.9%, a difference of 26.9%.
Delaware vs Immigrants from Somalia Single Father Poverty

Single Father Poverty Correlation Summary

MeasurementDelawareImmigrants from Somalia
Minimum7.7%4.1%
Maximum81.2%35.9%
Range73.6%31.8%
Mean29.6%16.5%
Median25.0%15.3%
Interquartile 25% (IQ1)17.5%13.0%
Interquartile 75% (IQ3)37.5%18.6%
Interquartile Range (IQR)20.1%5.6%
Standard Deviation (Sample)18.0%6.7%
Standard Deviation (Population)17.7%6.7%

Similar Demographics by Single Father Poverty

Demographics Similar to Delaware by Single Father Poverty

In terms of single father poverty, the demographic groups most similar to Delaware are Potawatomi (18.9%, a difference of 0.16%), Chickasaw (19.0%, a difference of 0.16%), Immigrants from Dominica (18.9%, a difference of 0.36%), Nonimmigrants (18.8%, a difference of 0.42%), and Osage (19.0%, a difference of 0.56%).
DemographicsRating | RankSingle Father Poverty
French Canadians
0.0
/100
|
#307
Tragic
18.6%
Ottawa
0.0
/100
|
#308
Tragic
18.6%
Immigrants | Micronesia
0.0
/100
|
#309
Tragic
18.6%
Chippewa
0.0
/100
|
#310
Tragic
18.8%
Immigrants | Nonimmigrants
0.0
/100
|
#311
Tragic
18.8%
Immigrants | Dominica
0.0
/100
|
#312
Tragic
18.9%
Potawatomi
0.0
/100
|
#313
Tragic
18.9%
Delaware
0.0
/100
|
#314
Tragic
18.9%
Chickasaw
0.0
/100
|
#315
Tragic
19.0%
Osage
0.0
/100
|
#316
Tragic
19.0%
Dominicans
0.0
/100
|
#317
Tragic
19.1%
Dutch West Indians
0.0
/100
|
#318
Tragic
19.2%
Slovaks
0.0
/100
|
#319
Tragic
19.3%
Inupiat
0.0
/100
|
#320
Tragic
19.5%
Cherokee
0.0
/100
|
#321
Tragic
19.6%

Demographics Similar to Immigrants from Somalia by Single Father Poverty

In terms of single father poverty, the demographic groups most similar to Immigrants from Somalia are Immigrants from Cambodia (14.9%, a difference of 0.12%), Immigrants from China (14.9%, a difference of 0.15%), Salvadoran (14.9%, a difference of 0.16%), Malaysian (14.9%, a difference of 0.16%), and Immigrants from Eastern Asia (15.0%, a difference of 0.31%).
DemographicsRating | RankSingle Father Poverty
Bolivians
100.0
/100
|
#38
Exceptional
14.7%
Immigrants | Asia
100.0
/100
|
#39
Exceptional
14.7%
Pima
100.0
/100
|
#40
Exceptional
14.8%
Indians (Asian)
100.0
/100
|
#41
Exceptional
14.8%
Immigrants | Nepal
100.0
/100
|
#42
Exceptional
14.8%
Immigrants | Eritrea
100.0
/100
|
#43
Exceptional
14.8%
Salvadorans
100.0
/100
|
#44
Exceptional
14.9%
Immigrants | Somalia
100.0
/100
|
#45
Exceptional
14.9%
Immigrants | Cambodia
99.9
/100
|
#46
Exceptional
14.9%
Immigrants | China
99.9
/100
|
#47
Exceptional
14.9%
Malaysians
99.9
/100
|
#48
Exceptional
14.9%
Immigrants | Eastern Asia
99.9
/100
|
#49
Exceptional
15.0%
Bhutanese
99.9
/100
|
#50
Exceptional
15.0%
Immigrants | Pakistan
99.9
/100
|
#51
Exceptional
15.0%
Immigrants | El Salvador
99.9
/100
|
#52
Exceptional
15.0%