Danish vs Senegalese Median Earnings
COMPARE
Danish
Senegalese
Median Earnings
Median Earnings Comparison
Danes
Senegalese
$46,392
MEDIAN EARNINGS
48.6/ 100
METRIC RATING
176th/ 347
METRIC RANK
$44,373
MEDIAN EARNINGS
5.3/ 100
METRIC RATING
239th/ 347
METRIC RANK
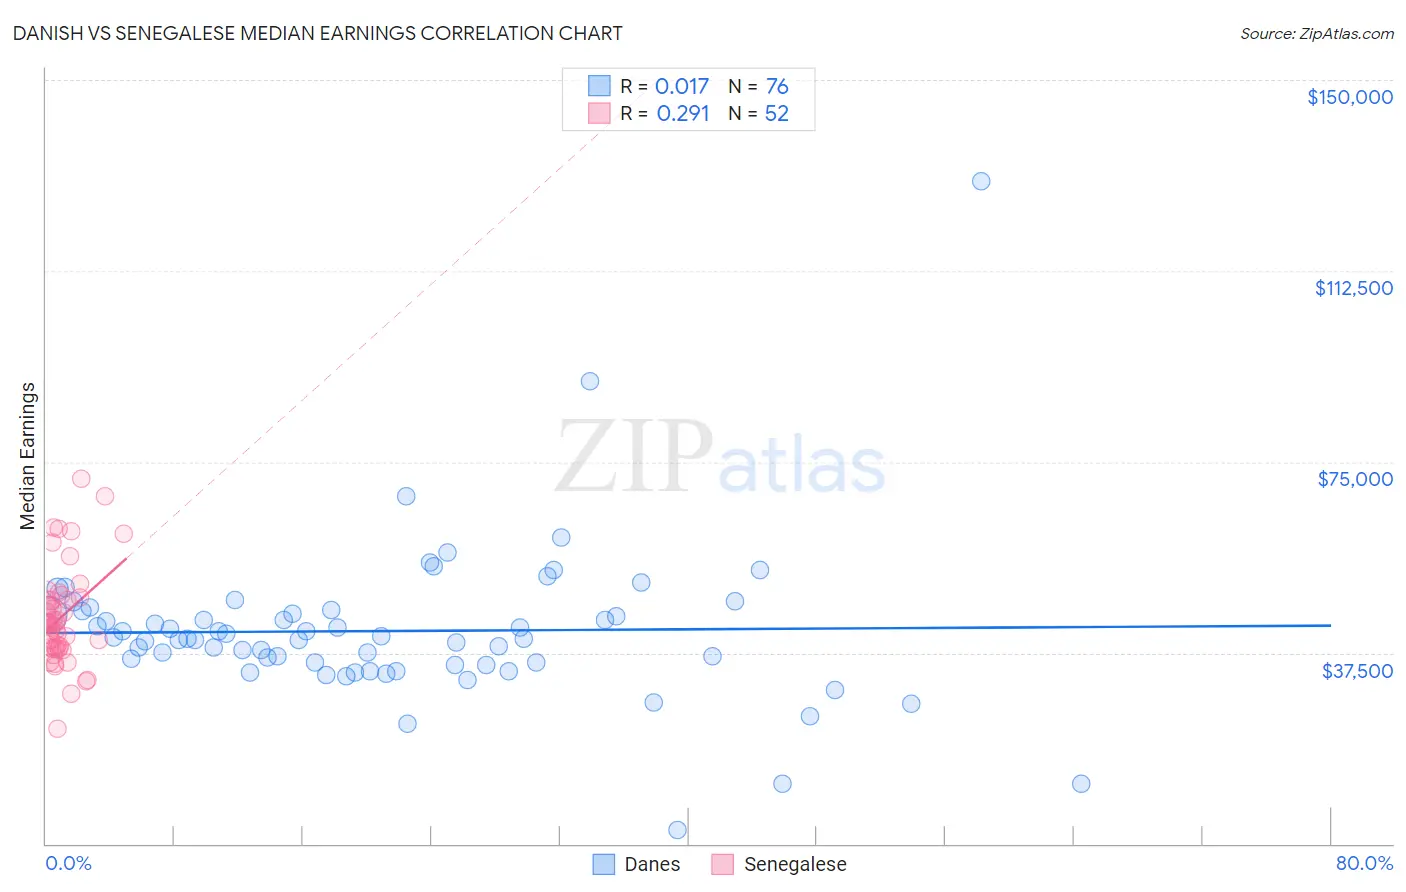
Danish vs Senegalese Median Earnings Correlation Chart
The statistical analysis conducted on geographies consisting of 474,068,327 people shows no correlation between the proportion of Danes and median earnings in the United States with a correlation coefficient (R) of 0.017 and weighted average of $46,392. Similarly, the statistical analysis conducted on geographies consisting of 78,107,065 people shows a weak positive correlation between the proportion of Senegalese and median earnings in the United States with a correlation coefficient (R) of 0.291 and weighted average of $44,373, a difference of 4.5%.
Median Earnings Correlation Summary
| Measurement | Danish | Senegalese |
| Minimum | $2,766 | $22,537 |
| Maximum | $130,117 | $71,772 |
| Range | $127,351 | $49,235 |
| Mean | $41,795 | $44,574 |
| Median | $40,260 | $43,248 |
| Interquartile 25% (IQ1) | $35,372 | $38,422 |
| Interquartile 75% (IQ3) | $45,489 | $48,145 |
| Interquartile Range (IQR) | $10,117 | $9,723 |
| Standard Deviation (Sample) | $15,565 | $9,701 |
| Standard Deviation (Population) | $15,462 | $9,608 |
Similar Demographics by Median Earnings
Demographics Similar to Danes by Median Earnings
In terms of median earnings, the demographic groups most similar to Danes are Basque ($46,399, a difference of 0.020%), Belgian ($46,375, a difference of 0.040%), Scandinavian ($46,433, a difference of 0.090%), Colombian ($46,349, a difference of 0.090%), and Ghanaian ($46,440, a difference of 0.10%).
| Demographics | Rating | Rank | Median Earnings |
| Immigrants | South America | 54.0 /100 | #169 | Average $46,548 |
| Immigrants | Immigrants | 51.6 /100 | #170 | Average $46,478 |
| Scottish | 51.1 /100 | #171 | Average $46,463 |
| Kenyans | 51.0 /100 | #172 | Average $46,462 |
| Ghanaians | 50.3 /100 | #173 | Average $46,440 |
| Scandinavians | 50.0 /100 | #174 | Average $46,433 |
| Basques | 48.8 /100 | #175 | Average $46,399 |
| Danes | 48.6 /100 | #176 | Average $46,392 |
| Belgians | 48.0 /100 | #177 | Average $46,375 |
| Colombians | 47.1 /100 | #178 | Average $46,349 |
| English | 46.5 /100 | #179 | Average $46,334 |
| Puget Sound Salish | 46.5 /100 | #180 | Average $46,333 |
| Immigrants | Cameroon | 46.4 /100 | #181 | Average $46,329 |
| Swiss | 45.9 /100 | #182 | Average $46,315 |
| French | 45.2 /100 | #183 | Average $46,296 |
Demographics Similar to Senegalese by Median Earnings
In terms of median earnings, the demographic groups most similar to Senegalese are Sudanese ($44,419, a difference of 0.10%), Immigrants from Ecuador ($44,462, a difference of 0.20%), Aleut ($44,241, a difference of 0.30%), Samoan ($44,206, a difference of 0.38%), and British West Indian ($44,552, a difference of 0.40%).
| Demographics | Rating | Rank | Median Earnings |
| Delaware | 9.0 /100 | #232 | Tragic $44,783 |
| Immigrants | Sudan | 8.8 /100 | #233 | Tragic $44,767 |
| Cape Verdeans | 7.5 /100 | #234 | Tragic $44,640 |
| Venezuelans | 6.9 /100 | #235 | Tragic $44,580 |
| British West Indians | 6.7 /100 | #236 | Tragic $44,552 |
| Immigrants | Ecuador | 5.9 /100 | #237 | Tragic $44,462 |
| Sudanese | 5.6 /100 | #238 | Tragic $44,419 |
| Senegalese | 5.3 /100 | #239 | Tragic $44,373 |
| Aleuts | 4.4 /100 | #240 | Tragic $44,241 |
| Samoans | 4.2 /100 | #241 | Tragic $44,206 |
| Immigrants | Venezuela | 4.0 /100 | #242 | Tragic $44,163 |
| Sub-Saharan Africans | 3.7 /100 | #243 | Tragic $44,118 |
| Immigrants | Nonimmigrants | 3.7 /100 | #244 | Tragic $44,117 |
| Immigrants | Burma/Myanmar | 3.2 /100 | #245 | Tragic $43,998 |
| Immigrants | West Indies | 3.1 /100 | #246 | Tragic $43,989 |