Cypriot vs New Zealander Receiving Food Stamps
COMPARE
Cypriot
New Zealander
Receiving Food Stamps
Receiving Food Stamps Comparison
Cypriots
New Zealanders
8.9%
RECEIVING FOOD STAMPS
99.9/ 100
METRIC RATING
12th/ 347
METRIC RANK
9.9%
RECEIVING FOOD STAMPS
98.8/ 100
METRIC RATING
74th/ 347
METRIC RANK
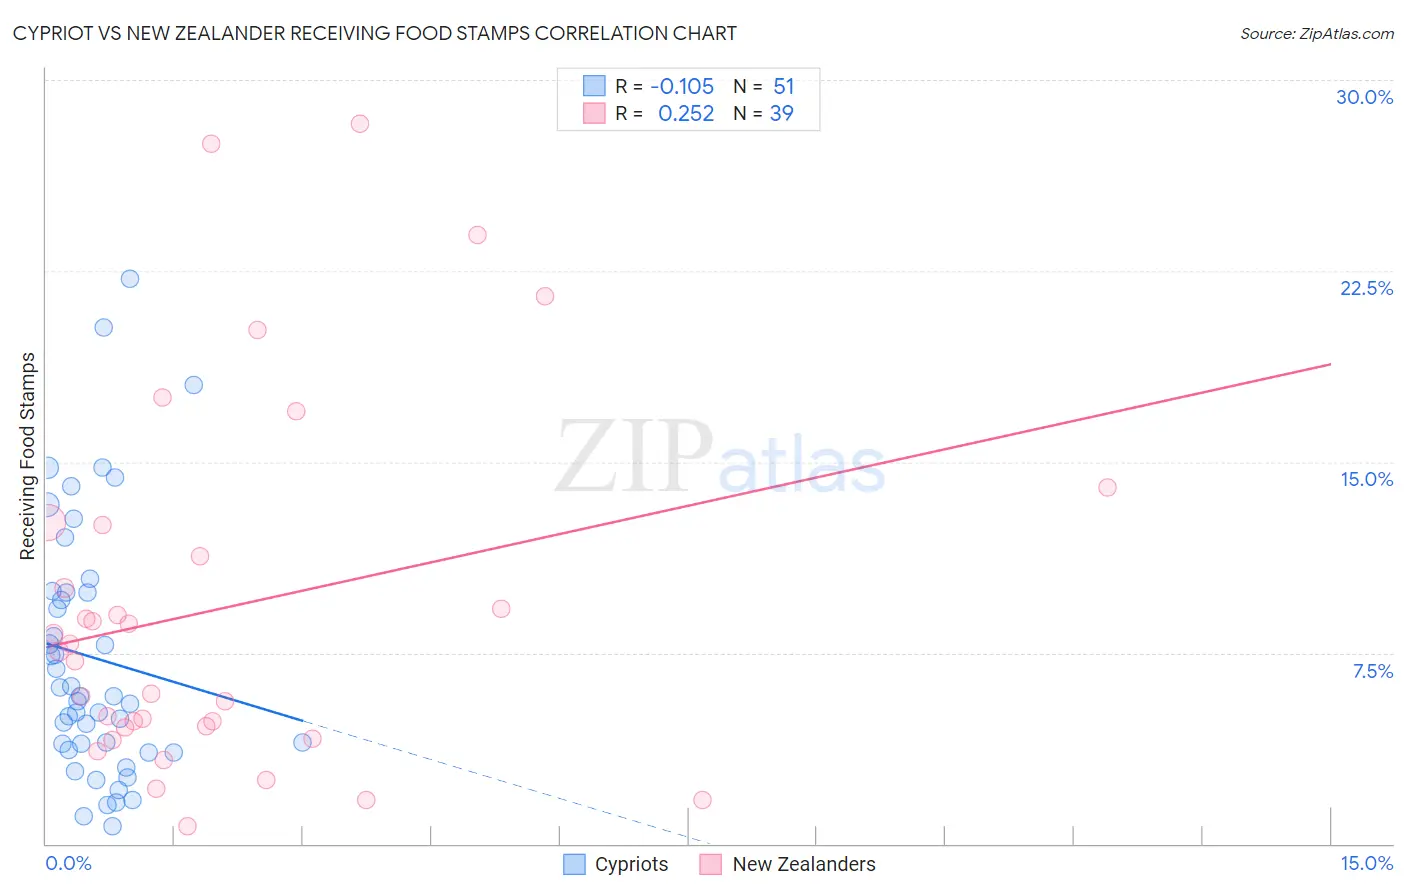
Cypriot vs New Zealander Receiving Food Stamps Correlation Chart
The statistical analysis conducted on geographies consisting of 61,805,635 people shows a poor negative correlation between the proportion of Cypriots and percentage of population receiving government assistance and/or food stamps in the United States with a correlation coefficient (R) of -0.105 and weighted average of 8.9%. Similarly, the statistical analysis conducted on geographies consisting of 106,821,914 people shows a weak positive correlation between the proportion of New Zealanders and percentage of population receiving government assistance and/or food stamps in the United States with a correlation coefficient (R) of 0.252 and weighted average of 9.9%, a difference of 11.8%.
Receiving Food Stamps Correlation Summary
| Measurement | Cypriot | New Zealander |
| Minimum | 0.70% | 0.70% |
| Maximum | 22.2% | 28.3% |
| Range | 21.5% | 27.6% |
| Mean | 7.3% | 9.3% |
| Median | 5.8% | 7.6% |
| Interquartile 25% (IQ1) | 3.7% | 4.6% |
| Interquartile 75% (IQ3) | 9.9% | 12.5% |
| Interquartile Range (IQR) | 6.2% | 7.9% |
| Standard Deviation (Sample) | 5.0% | 7.1% |
| Standard Deviation (Population) | 5.0% | 7.0% |
Similar Demographics by Receiving Food Stamps
Demographics Similar to Cypriots by Receiving Food Stamps
In terms of receiving food stamps, the demographic groups most similar to Cypriots are Okinawan (8.9%, a difference of 0.010%), Bulgarian (8.9%, a difference of 0.19%), Maltese (8.9%, a difference of 0.33%), Immigrants from South Central Asia (8.8%, a difference of 0.44%), and Norwegian (9.0%, a difference of 0.99%).
| Demographics | Rating | Rank | Receiving Food Stamps |
| Thais | 100.0 /100 | #5 | Exceptional 8.1% |
| Immigrants | Singapore | 100.0 /100 | #6 | Exceptional 8.3% |
| Immigrants | Iran | 100.0 /100 | #7 | Exceptional 8.3% |
| Burmese | 99.9 /100 | #8 | Exceptional 8.6% |
| Immigrants | Korea | 99.9 /100 | #9 | Exceptional 8.7% |
| Immigrants | South Central Asia | 99.9 /100 | #10 | Exceptional 8.8% |
| Okinawans | 99.9 /100 | #11 | Exceptional 8.9% |
| Cypriots | 99.9 /100 | #12 | Exceptional 8.9% |
| Bulgarians | 99.9 /100 | #13 | Exceptional 8.9% |
| Maltese | 99.9 /100 | #14 | Exceptional 8.9% |
| Norwegians | 99.9 /100 | #15 | Exceptional 9.0% |
| Immigrants | Japan | 99.9 /100 | #16 | Exceptional 9.0% |
| Immigrants | Scotland | 99.9 /100 | #17 | Exceptional 9.0% |
| Danes | 99.9 /100 | #18 | Exceptional 9.0% |
| Immigrants | Hong Kong | 99.8 /100 | #19 | Exceptional 9.1% |
Demographics Similar to New Zealanders by Receiving Food Stamps
In terms of receiving food stamps, the demographic groups most similar to New Zealanders are Macedonian (9.9%, a difference of 0.16%), Immigrants from Asia (9.9%, a difference of 0.23%), Immigrants from Zimbabwe (9.9%, a difference of 0.29%), Immigrants from Croatia (10.0%, a difference of 0.30%), and Immigrants from North Macedonia (10.0%, a difference of 0.39%).
| Demographics | Rating | Rank | Receiving Food Stamps |
| Immigrants | Indonesia | 99.0 /100 | #67 | Exceptional 9.8% |
| Northern Europeans | 99.0 /100 | #68 | Exceptional 9.8% |
| Italians | 99.0 /100 | #69 | Exceptional 9.9% |
| Immigrants | Serbia | 99.0 /100 | #70 | Exceptional 9.9% |
| Scottish | 98.9 /100 | #71 | Exceptional 9.9% |
| Immigrants | Asia | 98.9 /100 | #72 | Exceptional 9.9% |
| Macedonians | 98.9 /100 | #73 | Exceptional 9.9% |
| New Zealanders | 98.8 /100 | #74 | Exceptional 9.9% |
| Immigrants | Zimbabwe | 98.7 /100 | #75 | Exceptional 9.9% |
| Immigrants | Croatia | 98.7 /100 | #76 | Exceptional 10.0% |
| Immigrants | North Macedonia | 98.7 /100 | #77 | Exceptional 10.0% |
| South Africans | 98.7 /100 | #78 | Exceptional 10.0% |
| Laotians | 98.7 /100 | #79 | Exceptional 10.0% |
| Poles | 98.6 /100 | #80 | Exceptional 10.0% |
| Immigrants | England | 98.6 /100 | #81 | Exceptional 10.0% |