Cypriot vs Sri Lankan Receiving Food Stamps

COMPARE

Cypriot
Race
Ancestry
AfghanAfricanAlaska NativeAlaskan AthabascanAlbanianAleutAlsatianAmericanApacheArabArapahoArgentineanArmenianAssyrian/Chaldean/SyriacAustralianAustrianBahamianBangladeshiBarbadianBasqueBelgianBelizeanBermudanBhutaneseBlackfeetBolivianBrazilianBritishBritish West IndianBulgarianBurmeseCajunCambodianCanadianCape VerdeanCarpatho RusynCelticCentral AmericanCentral American IndianCherokeeCheyenneChickasawChileanChineseChippewaChoctawColombianColvilleComancheCosta RicanCreeCreekCroatianCrowCubanCypriotCzechCzechoslovakianDanishDelawareDominicanDutchDutch West IndianEastern EuropeanEcuadorianEgyptianEnglishEstonianEthiopianEuropeanFijianFilipinoFinnishFrenchFrench American IndianFrench CanadianGermanGerman RussianGhanaianGreekGuamanian/ChamorroGuatemalanGuyaneseHaitianHmongHonduranHopiHoumaHungarianIcelanderIndian (Asian)IndonesianInupiatIranianIraqiIrishIroquoisIsraeliItalianJamaicanJapaneseJordanianKenyanKiowaKoreanLaotianLatvianLebaneseLiberianLithuanianLumbeeLuxembourgerMacedonianMalaysianMalteseMarshalleseMenomineeMexicanMexican American IndianMongolianMoroccanNative HawaiianNavajoNepaleseNew ZealanderNicaraguanNigerianNorthern EuropeanNorwegianOkinawanOsageOttawaPaiutePakistaniPalestinianPanamanianParaguayanPennsylvania GermanPeruvianPimaPolishPortuguesePotawatomiPuebloPuerto RicanPuget Sound SalishRomanianRussianSalvadoranSamoanScandinavianScotch-IrishScottishSeminoleSenegaleseSerbianShoshoneSierra LeoneanSiouxSlavicSlovakSloveneSomaliSouth AfricanSouth AmericanSouth American IndianSoviet UnionSpaniardSpanishSpanish AmericanSpanish American IndianSubsaharan AfricanSudaneseSwedishSwissSyrianTaiwaneseThaiTlingit-HaidaTohono O'OdhamTonganTrinidadian and TobagonianTsimshianTurkishU.S. Virgin IslanderUgandanUkrainianUruguayanUteVenezuelanVietnameseWelshWest IndianYakamaYaquiYugoslavianYumanYup'ikZimbabwean
Immigration
NonimmigrantsImmigrantsAfghanistanAfricaAlbaniaArgentinaArmeniaAsiaAustraliaAustriaBahamasBangladeshBarbadosBelarusBelgiumBelizeBoliviaBosnia and HerzegovinaBrazilBulgariaBurma/MyanmarCabo VerdeCambodiaCameroonCanadaCaribbeanCentral AmericaChileChinaColombiaCongoCosta RicaCroatiaCubaCzechoslovakiaDenmarkDominicaDominican RepublicEastern AfricaEastern AsiaEastern EuropeEcuadorEgyptEl SalvadorEnglandEritreaEthiopiaEuropeFijiFranceGermanyGhanaGreeceGrenadaGuatemalaGuyanaHaitiHondurasHong KongHungaryIndiaIndonesiaIranIraqIrelandIsraelItalyJamaicaJapanJordanKazakhstanKenyaKoreaKuwaitLaosLatin AmericaLatviaLebanonLiberiaLithuaniaMalaysiaMexicoMicronesiaMiddle AfricaMoldovaMoroccoNepalNetherlandsNicaraguaNigeriaNorth AmericaNorth MacedoniaNorthern AfricaNorthern EuropeNorwayOceaniaPakistanPanamaPeruPhilippinesPolandPortugalRomaniaRussiaSaudi ArabiaScotlandSenegalSerbiaSierra LeoneSingaporeSomaliaSouth AfricaSouth AmericaSouth Central AsiaSouth Eastern AsiaSouthern EuropeSpainSri LankaSt. Vincent and the GrenadinesSudanSwedenSwitzerlandSyriaTaiwanThailandTrinidad and TobagoTurkeyUgandaUkraineUruguayUzbekistanVenezuelaVietnamWest IndiesWestern AfricaWestern AsiaWestern EuropeYemenZaireZimbabweAzores
Sri Lankan
Race
Ancestry
AfghanAfricanAlaska NativeAlaskan AthabascanAlbanianAleutAlsatianAmericanApacheArabArapahoArgentineanArmenianAssyrian/Chaldean/SyriacAustralianAustrianBahamianBangladeshiBarbadianBasqueBelgianBelizeanBermudanBhutaneseBlackfeetBolivianBrazilianBritishBritish West IndianBulgarianBurmeseCajunCambodianCanadianCape VerdeanCarpatho RusynCelticCentral AmericanCentral American IndianCherokeeCheyenneChickasawChileanChineseChippewaChoctawColombianColvilleComancheCosta RicanCreeCreekCroatianCrowCubanCzechCzechoslovakianDanishDelawareDominicanDutchDutch West IndianEastern EuropeanEcuadorianEgyptianEnglishEstonianEthiopianEuropeanFijianFilipinoFinnishFrenchFrench American IndianFrench CanadianGermanGerman RussianGhanaianGreekGuamanian/ChamorroGuatemalanGuyaneseHaitianHmongHonduranHopiHoumaHungarianIcelanderIndian (Asian)IndonesianInupiatIranianIraqiIrishIroquoisIsraeliItalianJamaicanJapaneseJordanianKenyanKiowaKoreanLaotianLatvianLebaneseLiberianLithuanianLumbeeLuxembourgerMacedonianMalaysianMalteseMarshalleseMenomineeMexicanMexican American IndianMongolianMoroccanNative HawaiianNavajoNepaleseNew ZealanderNicaraguanNigerianNorthern EuropeanNorwegianOkinawanOsageOttawaPaiutePakistaniPalestinianPanamanianParaguayanPennsylvania GermanPeruvianPimaPolishPortuguesePotawatomiPuebloPuerto RicanPuget Sound SalishRomanianRussianSalvadoranSamoanScandinavianScotch-IrishScottishSeminoleSenegaleseSerbianShoshoneSierra LeoneanSiouxSlavicSlovakSloveneSomaliSouth AfricanSouth AmericanSouth American IndianSoviet UnionSpaniardSpanishSpanish AmericanSpanish American IndianSri LankanSubsaharan AfricanSudaneseSwedishSwissSyrianTaiwaneseThaiTlingit-HaidaTohono O'OdhamTonganTrinidadian and TobagonianTsimshianTurkishU.S. Virgin IslanderUgandanUkrainianUruguayanUteVenezuelanVietnameseWelshWest IndianYakamaYaquiYugoslavianYumanYup'ikZimbabwean
Immigration
NonimmigrantsImmigrantsAfghanistanAfricaAlbaniaArgentinaArmeniaAsiaAustraliaAustriaBahamasBangladeshBarbadosBelarusBelgiumBelizeBoliviaBosnia and HerzegovinaBrazilBulgariaBurma/MyanmarCabo VerdeCambodiaCameroonCanadaCaribbeanCentral AmericaChileChinaColombiaCongoCosta RicaCroatiaCubaCzechoslovakiaDenmarkDominicaDominican RepublicEastern AfricaEastern AsiaEastern EuropeEcuadorEgyptEl SalvadorEnglandEritreaEthiopiaEuropeFijiFranceGermanyGhanaGreeceGrenadaGuatemalaGuyanaHaitiHondurasHong KongHungaryIndiaIndonesiaIranIraqIrelandIsraelItalyJamaicaJapanJordanKazakhstanKenyaKoreaKuwaitLaosLatin AmericaLatviaLebanonLiberiaLithuaniaMalaysiaMexicoMicronesiaMiddle AfricaMoldovaMoroccoNepalNetherlandsNicaraguaNigeriaNorth AmericaNorth MacedoniaNorthern AfricaNorthern EuropeNorwayOceaniaPakistanPanamaPeruPhilippinesPolandPortugalRomaniaRussiaSaudi ArabiaScotlandSenegalSerbiaSierra LeoneSingaporeSomaliaSouth AfricaSouth AmericaSouth Central AsiaSouth Eastern AsiaSouthern EuropeSpainSri LankaSt. Vincent and the GrenadinesSudanSwedenSwitzerlandSyriaTaiwanThailandTrinidad and TobagoTurkeyUgandaUkraineUruguayUzbekistanVenezuelaVietnamWest IndiesWestern AfricaWestern AsiaWestern EuropeYemenZaireZimbabweAzores
Receiving Food Stamps
Income
Poverty
Unemployment
Labor Participation
Family Structure
Vehicle Availability
Education Level
Disability

Receiving Food Stamps Comparison

Cypriots

Sri Lankans

Exceptional
Exceptional
8.9%
RECEIVING FOOD STAMPS
99.9/ 100
METRIC RATING
12th/ 347
METRIC RANK
10.6%
RECEIVING FOOD STAMPS
93.7/ 100
METRIC RATING
122nd/ 347
METRIC RANK

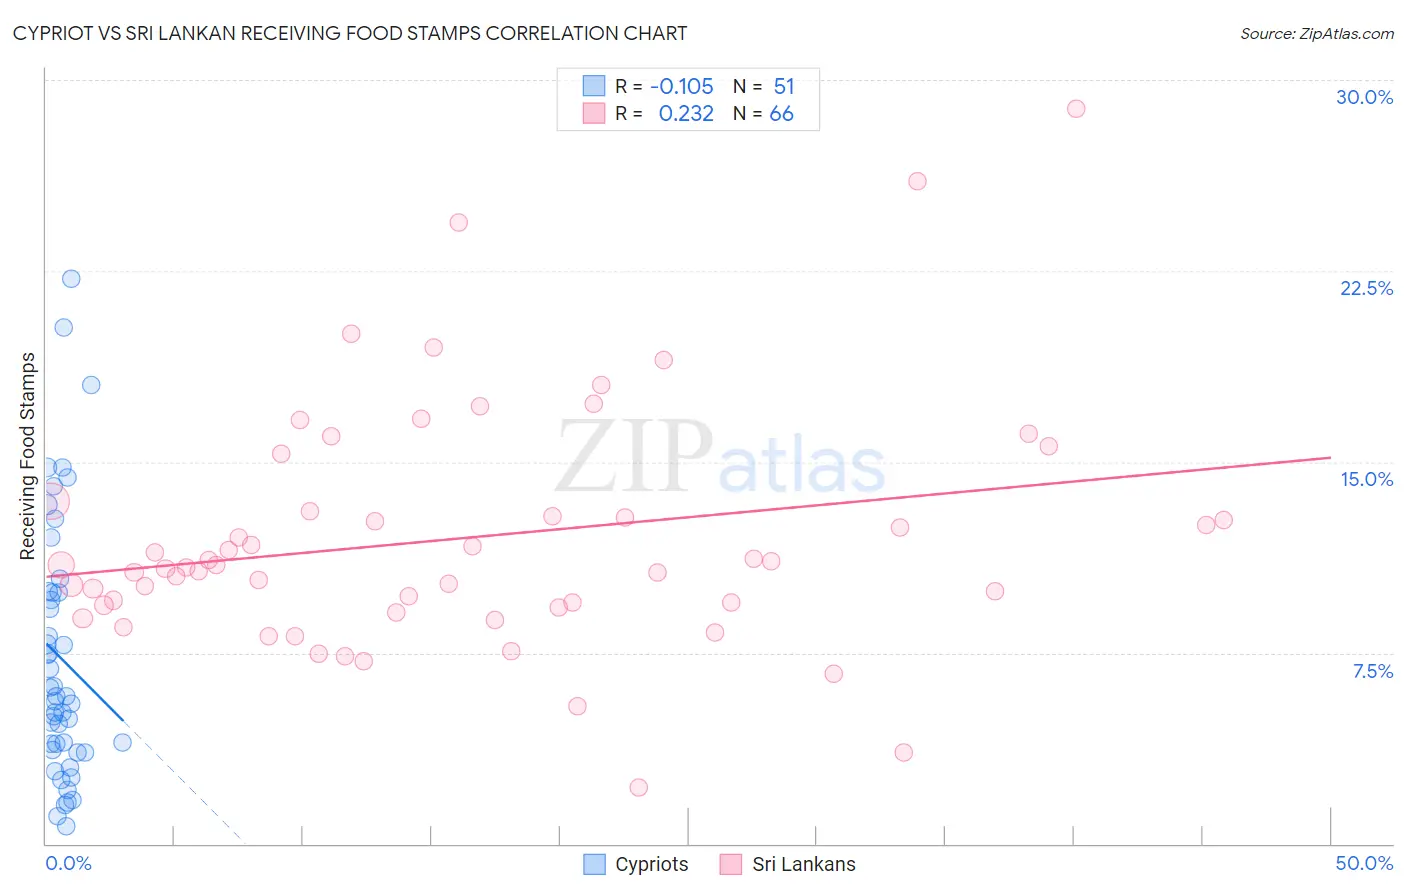
Cypriot vs Sri Lankan Receiving Food Stamps Correlation Chart

The statistical analysis conducted on geographies consisting of 61,805,635 people shows a poor negative correlation between the proportion of Cypriots and percentage of population receiving government assistance and/or food stamps in the United States with a correlation coefficient (R) of -0.105 and weighted average of 8.9%. Similarly, the statistical analysis conducted on geographies consisting of 439,146,185 people shows a weak positive correlation between the proportion of Sri Lankans and percentage of population receiving government assistance and/or food stamps in the United States with a correlation coefficient (R) of 0.232 and weighted average of 10.6%, a difference of 19.8%.
Cypriot vs Sri Lankan Receiving Food Stamps

Receiving Food Stamps Correlation Summary

MeasurementCypriotSri Lankan
Minimum0.70%2.2%
Maximum22.2%28.8%
Range21.5%26.6%
Mean7.3%12.0%
Median5.8%10.9%
Interquartile 25% (IQ1)3.7%9.4%
Interquartile 75% (IQ3)9.9%13.1%
Interquartile Range (IQR)6.2%3.7%
Standard Deviation (Sample)5.0%4.8%
Standard Deviation (Population)5.0%4.7%

Similar Demographics by Receiving Food Stamps

Demographics Similar to Cypriots by Receiving Food Stamps

In terms of receiving food stamps, the demographic groups most similar to Cypriots are Okinawan (8.9%, a difference of 0.010%), Bulgarian (8.9%, a difference of 0.19%), Maltese (8.9%, a difference of 0.33%), Immigrants from South Central Asia (8.8%, a difference of 0.44%), and Norwegian (9.0%, a difference of 0.99%).
DemographicsRating | RankReceiving Food Stamps
Thais
100.0
/100
|
#5
Exceptional
8.1%
Immigrants | Singapore
100.0
/100
|
#6
Exceptional
8.3%
Immigrants | Iran
100.0
/100
|
#7
Exceptional
8.3%
Burmese
99.9
/100
|
#8
Exceptional
8.6%
Immigrants | Korea
99.9
/100
|
#9
Exceptional
8.7%
Immigrants | South Central Asia
99.9
/100
|
#10
Exceptional
8.8%
Okinawans
99.9
/100
|
#11
Exceptional
8.9%
Cypriots
99.9
/100
|
#12
Exceptional
8.9%
Bulgarians
99.9
/100
|
#13
Exceptional
8.9%
Maltese
99.9
/100
|
#14
Exceptional
8.9%
Norwegians
99.9
/100
|
#15
Exceptional
9.0%
Immigrants | Japan
99.9
/100
|
#16
Exceptional
9.0%
Immigrants | Scotland
99.9
/100
|
#17
Exceptional
9.0%
Danes
99.9
/100
|
#18
Exceptional
9.0%
Immigrants | Hong Kong
99.8
/100
|
#19
Exceptional
9.1%

Demographics Similar to Sri Lankans by Receiving Food Stamps

In terms of receiving food stamps, the demographic groups most similar to Sri Lankans are Slavic (10.6%, a difference of 0.070%), Immigrants from Poland (10.6%, a difference of 0.11%), Ethiopian (10.6%, a difference of 0.11%), Immigrants from Philippines (10.7%, a difference of 0.25%), and Assyrian/Chaldean/Syriac (10.6%, a difference of 0.27%).
DemographicsRating | RankReceiving Food Stamps
Immigrants | Saudi Arabia
94.9
/100
|
#115
Exceptional
10.5%
Canadians
94.8
/100
|
#116
Exceptional
10.5%
Immigrants | Nepal
94.6
/100
|
#117
Exceptional
10.6%
Assyrians/Chaldeans/Syriacs
94.1
/100
|
#118
Exceptional
10.6%
Immigrants | Poland
93.9
/100
|
#119
Exceptional
10.6%
Ethiopians
93.9
/100
|
#120
Exceptional
10.6%
Slavs
93.8
/100
|
#121
Exceptional
10.6%
Sri Lankans
93.7
/100
|
#122
Exceptional
10.6%
Immigrants | Philippines
93.3
/100
|
#123
Exceptional
10.7%
Paraguayans
93.0
/100
|
#124
Exceptional
10.7%
Ukrainians
92.8
/100
|
#125
Exceptional
10.7%
Afghans
92.6
/100
|
#126
Exceptional
10.7%
Immigrants | Ethiopia
92.6
/100
|
#127
Exceptional
10.7%
Immigrants | Jordan
92.5
/100
|
#128
Exceptional
10.7%
Yugoslavians
92.5
/100
|
#129
Exceptional
10.7%