Cuban vs Immigrants from Argentina Single Mother Poverty
COMPARE
Cuban
Immigrants from Argentina
Single Mother Poverty
Single Mother Poverty Comparison
Cubans
Immigrants from Argentina
29.6%
SINGLE MOTHER POVERTY
20.8/ 100
METRIC RATING
199th/ 347
METRIC RANK
27.1%
SINGLE MOTHER POVERTY
99.7/ 100
METRIC RATING
51st/ 347
METRIC RANK
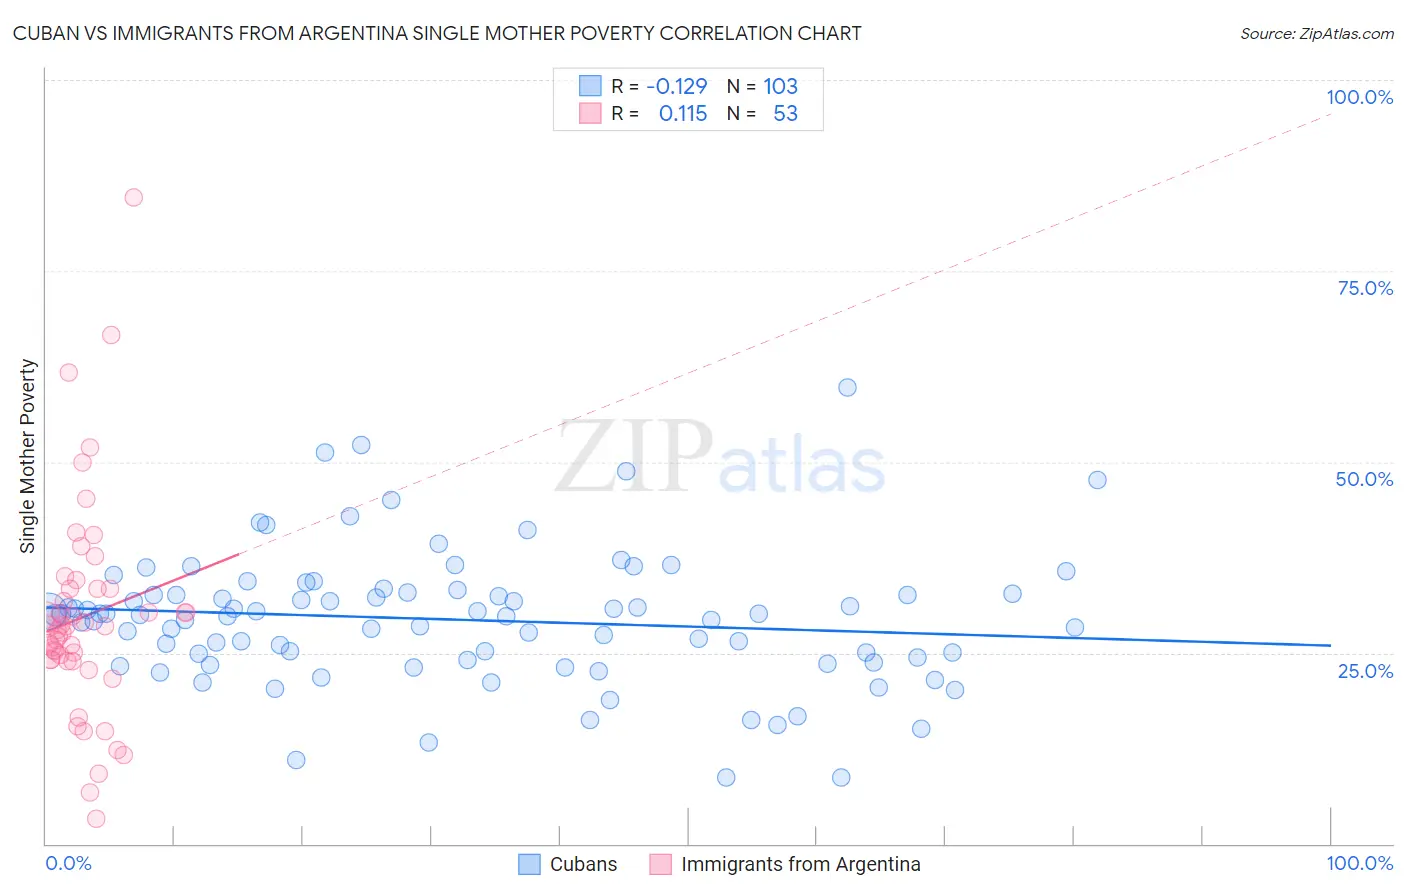
Cuban vs Immigrants from Argentina Single Mother Poverty Correlation Chart
The statistical analysis conducted on geographies consisting of 437,360,929 people shows a poor negative correlation between the proportion of Cubans and poverty level among single mothers in the United States with a correlation coefficient (R) of -0.129 and weighted average of 29.6%. Similarly, the statistical analysis conducted on geographies consisting of 259,658,600 people shows a poor positive correlation between the proportion of Immigrants from Argentina and poverty level among single mothers in the United States with a correlation coefficient (R) of 0.115 and weighted average of 27.1%, a difference of 9.3%.
Single Mother Poverty Correlation Summary
| Measurement | Cuban | Immigrants from Argentina |
| Minimum | 8.7% | 3.3% |
| Maximum | 59.8% | 84.6% |
| Range | 51.1% | 81.3% |
| Mean | 29.3% | 29.7% |
| Median | 29.9% | 28.5% |
| Interquartile 25% (IQ1) | 24.0% | 24.0% |
| Interquartile 75% (IQ3) | 32.7% | 33.3% |
| Interquartile Range (IQR) | 8.7% | 9.3% |
| Standard Deviation (Sample) | 8.7% | 14.2% |
| Standard Deviation (Population) | 8.7% | 14.1% |
Similar Demographics by Single Mother Poverty
Demographics Similar to Cubans by Single Mother Poverty
In terms of single mother poverty, the demographic groups most similar to Cubans are Panamanian (29.6%, a difference of 0.050%), Trinidadian and Tobagonian (29.6%, a difference of 0.070%), Immigrants from Jamaica (29.6%, a difference of 0.080%), Belgian (29.7%, a difference of 0.15%), and Spanish American Indian (29.6%, a difference of 0.18%).
| Demographics | Rating | Rank | Single Mother Poverty |
| Moroccans | 28.6 /100 | #192 | Fair 29.5% |
| Basques | 28.3 /100 | #193 | Fair 29.5% |
| Icelanders | 26.1 /100 | #194 | Fair 29.5% |
| Slavs | 24.5 /100 | #195 | Fair 29.6% |
| Spanish American Indians | 23.4 /100 | #196 | Fair 29.6% |
| Immigrants | Jamaica | 22.0 /100 | #197 | Fair 29.6% |
| Trinidadians and Tobagonians | 21.7 /100 | #198 | Fair 29.6% |
| Cubans | 20.8 /100 | #199 | Fair 29.6% |
| Panamanians | 20.0 /100 | #200 | Fair 29.6% |
| Belgians | 18.8 /100 | #201 | Poor 29.7% |
| Malaysians | 17.4 /100 | #202 | Poor 29.7% |
| Swiss | 17.2 /100 | #203 | Poor 29.7% |
| Immigrants | Immigrants | 16.6 /100 | #204 | Poor 29.7% |
| Czechoslovakians | 16.1 /100 | #205 | Poor 29.7% |
| Immigrants | Haiti | 15.8 /100 | #206 | Poor 29.7% |
Demographics Similar to Immigrants from Argentina by Single Mother Poverty
In terms of single mother poverty, the demographic groups most similar to Immigrants from Argentina are Immigrants from South Eastern Asia (27.1%, a difference of 0.040%), Immigrants from Jordan (27.1%, a difference of 0.080%), Immigrants from Bulgaria (27.1%, a difference of 0.11%), Immigrants from Egypt (27.1%, a difference of 0.14%), and Immigrants from Romania (27.2%, a difference of 0.19%).
| Demographics | Rating | Rank | Single Mother Poverty |
| Immigrants | Sierra Leone | 99.9 /100 | #44 | Exceptional 26.9% |
| Latvians | 99.9 /100 | #45 | Exceptional 26.9% |
| Immigrants | Serbia | 99.9 /100 | #46 | Exceptional 26.9% |
| Egyptians | 99.8 /100 | #47 | Exceptional 26.9% |
| Immigrants | Poland | 99.8 /100 | #48 | Exceptional 26.9% |
| Cambodians | 99.8 /100 | #49 | Exceptional 27.0% |
| Laotians | 99.8 /100 | #50 | Exceptional 27.0% |
| Immigrants | Argentina | 99.7 /100 | #51 | Exceptional 27.1% |
| Immigrants | South Eastern Asia | 99.7 /100 | #52 | Exceptional 27.1% |
| Immigrants | Jordan | 99.7 /100 | #53 | Exceptional 27.1% |
| Immigrants | Bulgaria | 99.7 /100 | #54 | Exceptional 27.1% |
| Immigrants | Egypt | 99.7 /100 | #55 | Exceptional 27.1% |
| Immigrants | Romania | 99.7 /100 | #56 | Exceptional 27.2% |
| Palestinians | 99.7 /100 | #57 | Exceptional 27.2% |
| Argentineans | 99.6 /100 | #58 | Exceptional 27.2% |