Cuban vs Immigrants from South Central Asia Single Female Poverty
COMPARE
Cuban
Immigrants from South Central Asia
Single Female Poverty
Single Female Poverty Comparison
Cubans
Immigrants from South Central Asia
21.0%
SINGLE FEMALE POVERTY
50.0/ 100
METRIC RATING
174th/ 347
METRIC RANK
17.8%
SINGLE FEMALE POVERTY
100.0/ 100
METRIC RATING
12th/ 347
METRIC RANK
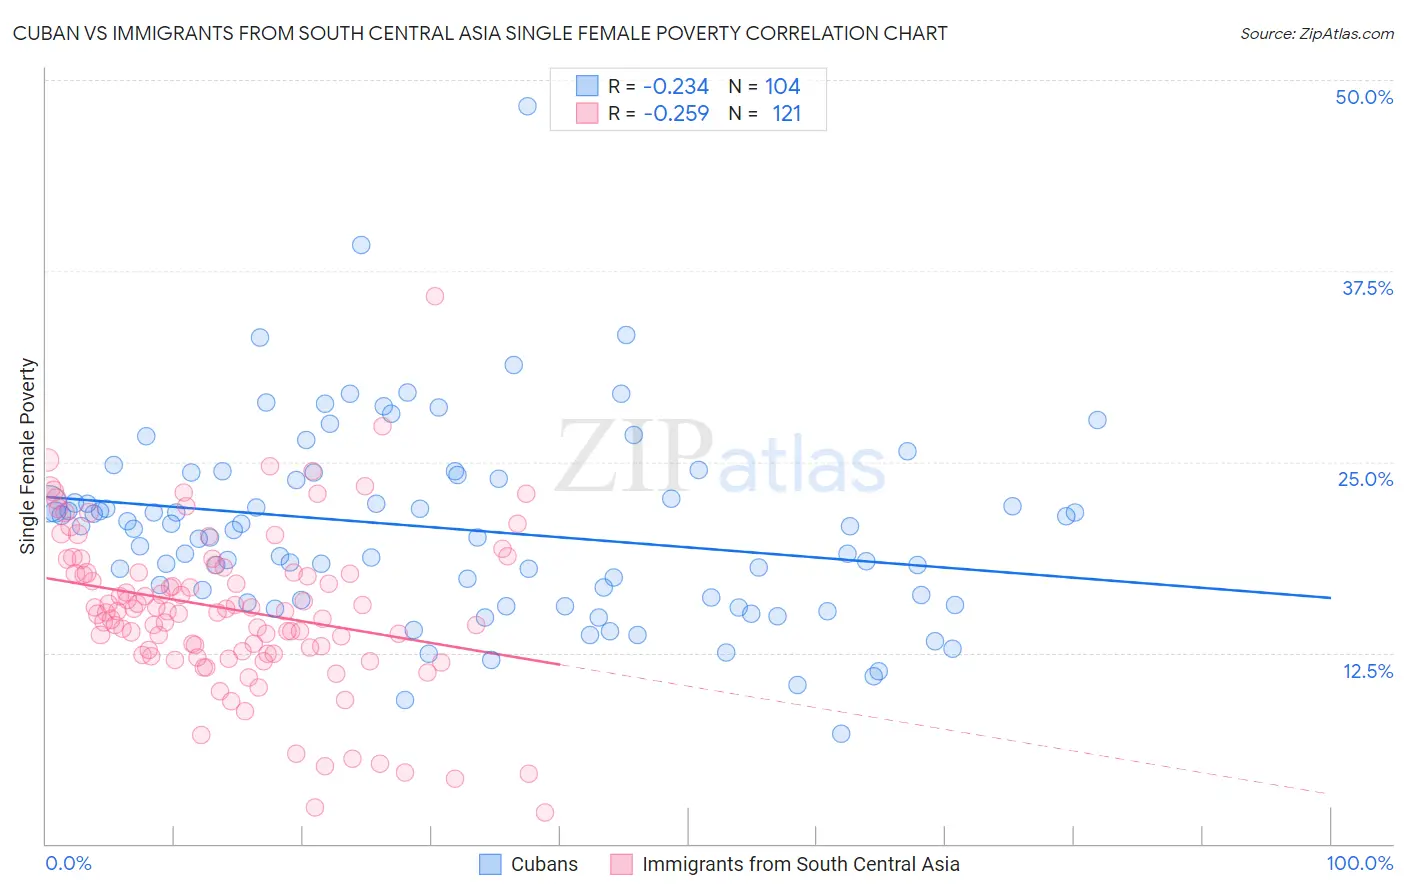
Cuban vs Immigrants from South Central Asia Single Female Poverty Correlation Chart
The statistical analysis conducted on geographies consisting of 441,584,431 people shows a weak negative correlation between the proportion of Cubans and poverty level among single females in the United States with a correlation coefficient (R) of -0.234 and weighted average of 21.0%. Similarly, the statistical analysis conducted on geographies consisting of 462,698,377 people shows a weak negative correlation between the proportion of Immigrants from South Central Asia and poverty level among single females in the United States with a correlation coefficient (R) of -0.259 and weighted average of 17.8%, a difference of 18.0%.
Single Female Poverty Correlation Summary
| Measurement | Cuban | Immigrants from South Central Asia |
| Minimum | 7.2% | 2.0% |
| Maximum | 48.3% | 35.8% |
| Range | 41.1% | 33.8% |
| Mean | 20.6% | 15.4% |
| Median | 20.6% | 15.2% |
| Interquartile 25% (IQ1) | 16.0% | 12.5% |
| Interquartile 75% (IQ3) | 24.0% | 18.0% |
| Interquartile Range (IQR) | 8.0% | 5.4% |
| Standard Deviation (Sample) | 6.3% | 5.2% |
| Standard Deviation (Population) | 6.3% | 5.2% |
Similar Demographics by Single Female Poverty
Demographics Similar to Cubans by Single Female Poverty
In terms of single female poverty, the demographic groups most similar to Cubans are Immigrants from Guyana (21.0%, a difference of 0.040%), Guyanese (21.0%, a difference of 0.13%), Moroccan (21.0%, a difference of 0.17%), New Zealander (21.0%, a difference of 0.20%), and Czech (21.0%, a difference of 0.20%).
| Demographics | Rating | Rank | Single Female Poverty |
| Immigrants | Norway | 63.0 /100 | #167 | Good 20.8% |
| Immigrants | Costa Rica | 61.5 /100 | #168 | Good 20.9% |
| Immigrants | Trinidad and Tobago | 56.3 /100 | #169 | Average 20.9% |
| New Zealanders | 53.2 /100 | #170 | Average 21.0% |
| Moroccans | 52.8 /100 | #171 | Average 21.0% |
| Guyanese | 52.0 /100 | #172 | Average 21.0% |
| Immigrants | Guyana | 50.6 /100 | #173 | Average 21.0% |
| Cubans | 50.0 /100 | #174 | Average 21.0% |
| Czechs | 46.8 /100 | #175 | Average 21.0% |
| Canadians | 45.4 /100 | #176 | Average 21.1% |
| Scandinavians | 45.2 /100 | #177 | Average 21.1% |
| Immigrants | Bosnia and Herzegovina | 44.9 /100 | #178 | Average 21.1% |
| British | 42.9 /100 | #179 | Average 21.1% |
| Spanish American Indians | 42.5 /100 | #180 | Average 21.1% |
| Europeans | 42.3 /100 | #181 | Average 21.1% |
Demographics Similar to Immigrants from South Central Asia by Single Female Poverty
In terms of single female poverty, the demographic groups most similar to Immigrants from South Central Asia are Immigrants from Lithuania (17.8%, a difference of 0.060%), Immigrants from Ireland (17.8%, a difference of 0.15%), Immigrants from Bolivia (17.8%, a difference of 0.26%), Bhutanese (17.7%, a difference of 0.56%), and Bolivian (17.9%, a difference of 0.70%).
| Demographics | Rating | Rank | Single Female Poverty |
| Assyrians/Chaldeans/Syriacs | 100.0 /100 | #5 | Exceptional 17.0% |
| Filipinos | 100.0 /100 | #6 | Exceptional 17.0% |
| Thais | 100.0 /100 | #7 | Exceptional 17.3% |
| Immigrants | Iran | 100.0 /100 | #8 | Exceptional 17.5% |
| Bhutanese | 100.0 /100 | #9 | Exceptional 17.7% |
| Immigrants | Ireland | 100.0 /100 | #10 | Exceptional 17.8% |
| Immigrants | Lithuania | 100.0 /100 | #11 | Exceptional 17.8% |
| Immigrants | South Central Asia | 100.0 /100 | #12 | Exceptional 17.8% |
| Immigrants | Bolivia | 100.0 /100 | #13 | Exceptional 17.8% |
| Bolivians | 100.0 /100 | #14 | Exceptional 17.9% |
| Indians (Asian) | 100.0 /100 | #15 | Exceptional 17.9% |
| Iranians | 100.0 /100 | #16 | Exceptional 18.0% |
| Immigrants | Korea | 100.0 /100 | #17 | Exceptional 18.1% |
| Immigrants | Eastern Asia | 100.0 /100 | #18 | Exceptional 18.1% |
| Immigrants | China | 100.0 /100 | #19 | Exceptional 18.1% |