Immigrants from Africa vs Guatemalan Single Female Poverty
COMPARE
Immigrants from Africa
Guatemalan
Single Female Poverty
Single Female Poverty Comparison
Immigrants from Africa
Guatemalans
21.5%
SINGLE FEMALE POVERTY
16.7/ 100
METRIC RATING
204th/ 347
METRIC RANK
23.8%
SINGLE FEMALE POVERTY
0.0/ 100
METRIC RATING
282nd/ 347
METRIC RANK
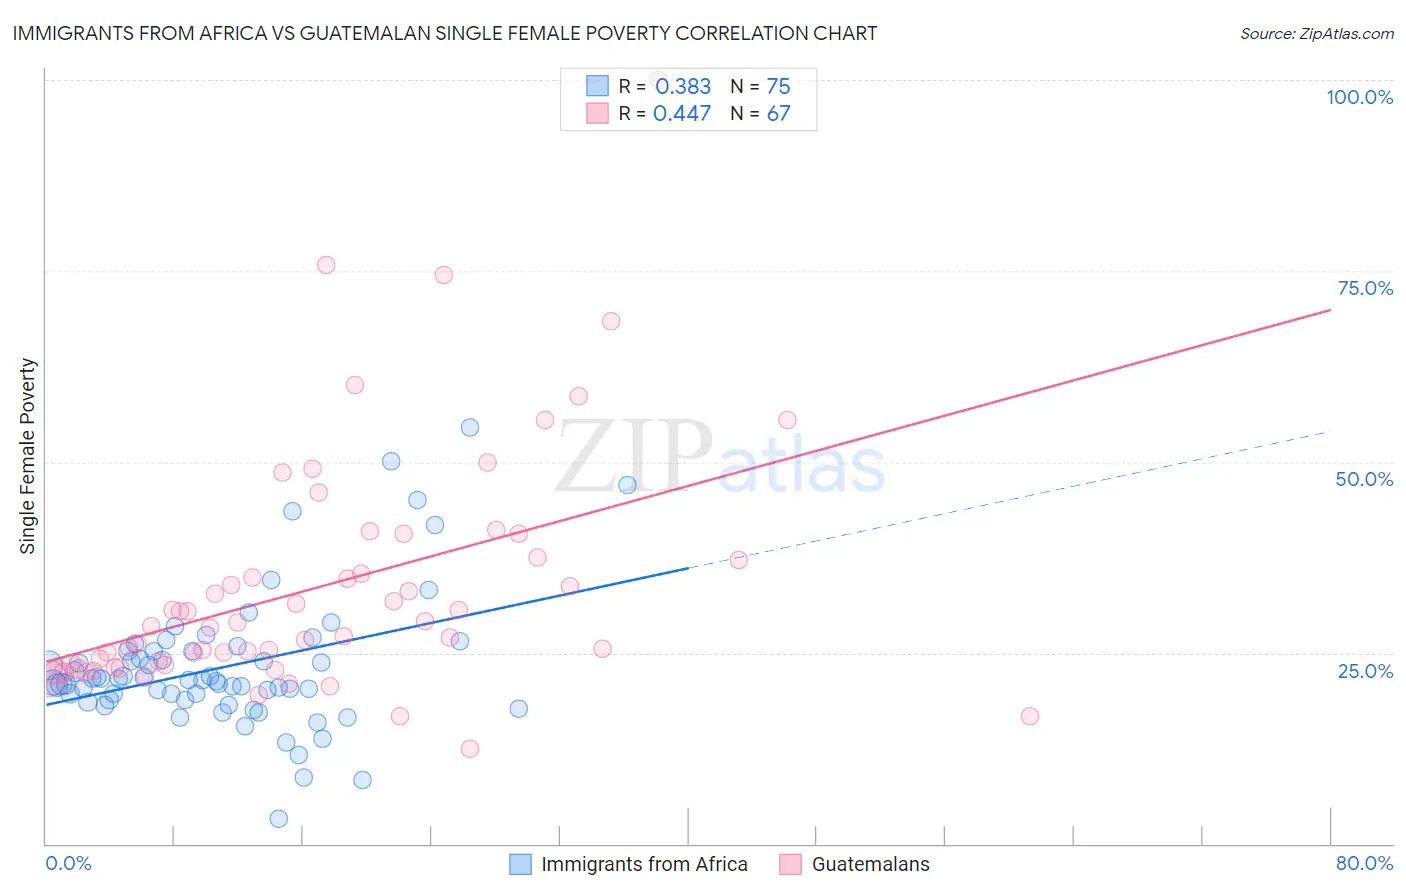
Immigrants from Africa vs Guatemalan Single Female Poverty Correlation Chart
The statistical analysis conducted on geographies consisting of 460,681,104 people shows a mild positive correlation between the proportion of Immigrants from Africa and poverty level among single females in the United States with a correlation coefficient (R) of 0.383 and weighted average of 21.5%. Similarly, the statistical analysis conducted on geographies consisting of 404,542,149 people shows a moderate positive correlation between the proportion of Guatemalans and poverty level among single females in the United States with a correlation coefficient (R) of 0.447 and weighted average of 23.8%, a difference of 10.8%.
Single Female Poverty Correlation Summary
| Measurement | Immigrants from Africa | Guatemalan |
| Minimum | 3.3% | 12.4% |
| Maximum | 54.5% | 100.0% |
| Range | 51.2% | 87.6% |
| Mean | 23.1% | 33.7% |
| Median | 21.5% | 28.4% |
| Interquartile 25% (IQ1) | 18.9% | 23.4% |
| Interquartile 75% (IQ3) | 25.2% | 37.5% |
| Interquartile Range (IQR) | 6.3% | 14.1% |
| Standard Deviation (Sample) | 8.8% | 15.8% |
| Standard Deviation (Population) | 8.7% | 15.7% |
Similar Demographics by Single Female Poverty
Demographics Similar to Immigrants from Africa by Single Female Poverty
In terms of single female poverty, the demographic groups most similar to Immigrants from Africa are Finnish (21.5%, a difference of 0.060%), Belgian (21.5%, a difference of 0.070%), Ghanaian (21.6%, a difference of 0.11%), Haitian (21.6%, a difference of 0.15%), and Immigrants from Eastern Africa (21.6%, a difference of 0.18%).
| Demographics | Rating | Rank | Single Female Poverty |
| Japanese | 26.4 /100 | #197 | Fair 21.3% |
| Swiss | 24.2 /100 | #198 | Fair 21.4% |
| Immigrants | Immigrants | 22.0 /100 | #199 | Fair 21.4% |
| Irish | 21.4 /100 | #200 | Fair 21.4% |
| Nigerians | 20.9 /100 | #201 | Fair 21.4% |
| Immigrants | Kenya | 20.7 /100 | #202 | Fair 21.4% |
| Immigrants | Haiti | 18.8 /100 | #203 | Poor 21.5% |
| Immigrants | Africa | 16.7 /100 | #204 | Poor 21.5% |
| Finns | 16.2 /100 | #205 | Poor 21.5% |
| Belgians | 16.1 /100 | #206 | Poor 21.5% |
| Ghanaians | 15.7 /100 | #207 | Poor 21.6% |
| Haitians | 15.4 /100 | #208 | Poor 21.6% |
| Immigrants | Eastern Africa | 15.1 /100 | #209 | Poor 21.6% |
| Immigrants | Panama | 14.4 /100 | #210 | Poor 21.6% |
| Icelanders | 14.0 /100 | #211 | Poor 21.6% |
Demographics Similar to Guatemalans by Single Female Poverty
In terms of single female poverty, the demographic groups most similar to Guatemalans are Immigrants from Zaire (23.8%, a difference of 0.050%), German Russian (23.9%, a difference of 0.14%), Immigrants from Dominica (23.9%, a difference of 0.25%), Immigrants from Latin America (23.7%, a difference of 0.56%), and Alaskan Athabascan (23.6%, a difference of 1.1%).
| Demographics | Rating | Rank | Single Female Poverty |
| Mexican American Indians | 0.1 /100 | #275 | Tragic 23.4% |
| Immigrants | Azores | 0.0 /100 | #276 | Tragic 23.5% |
| Pennsylvania Germans | 0.0 /100 | #277 | Tragic 23.6% |
| Immigrants | Nonimmigrants | 0.0 /100 | #278 | Tragic 23.6% |
| Alaskan Athabascans | 0.0 /100 | #279 | Tragic 23.6% |
| Immigrants | Latin America | 0.0 /100 | #280 | Tragic 23.7% |
| Immigrants | Zaire | 0.0 /100 | #281 | Tragic 23.8% |
| Guatemalans | 0.0 /100 | #282 | Tragic 23.8% |
| German Russians | 0.0 /100 | #283 | Tragic 23.9% |
| Immigrants | Dominica | 0.0 /100 | #284 | Tragic 23.9% |
| Immigrants | Guatemala | 0.0 /100 | #285 | Tragic 24.1% |
| Cree | 0.0 /100 | #286 | Tragic 24.1% |
| Bangladeshis | 0.0 /100 | #287 | Tragic 24.2% |
| Spanish Americans | 0.0 /100 | #288 | Tragic 24.2% |
| U.S. Virgin Islanders | 0.0 /100 | #289 | Tragic 24.2% |