Bulgarian vs Guatemalan Single Female Poverty
COMPARE
Bulgarian
Guatemalan
Single Female Poverty
Single Female Poverty Comparison
Bulgarians
Guatemalans
18.8%
SINGLE FEMALE POVERTY
99.9/ 100
METRIC RATING
39th/ 347
METRIC RANK
23.8%
SINGLE FEMALE POVERTY
0.0/ 100
METRIC RATING
282nd/ 347
METRIC RANK
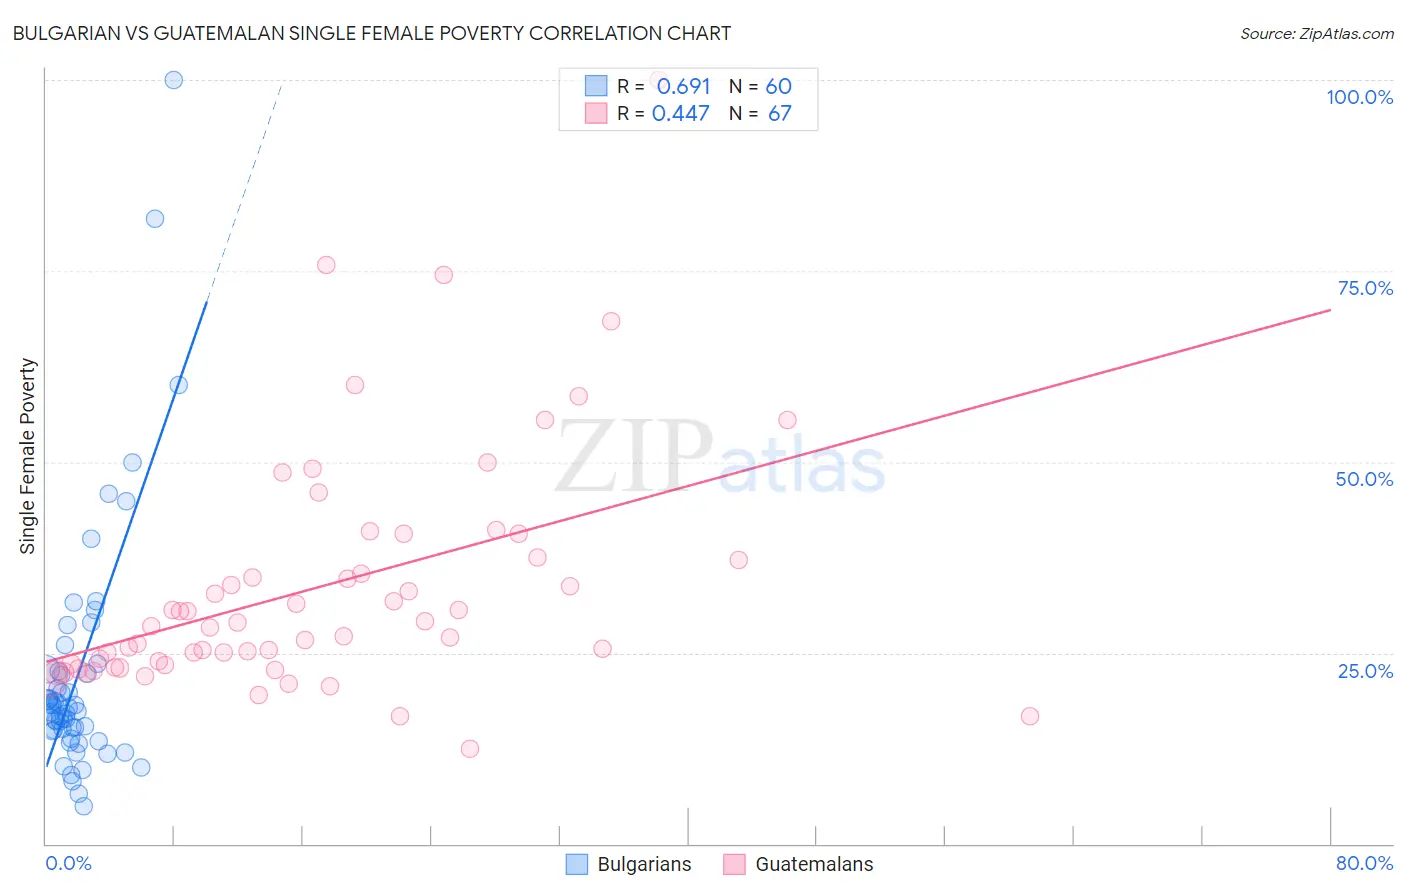
Bulgarian vs Guatemalan Single Female Poverty Correlation Chart
The statistical analysis conducted on geographies consisting of 203,529,625 people shows a significant positive correlation between the proportion of Bulgarians and poverty level among single females in the United States with a correlation coefficient (R) of 0.691 and weighted average of 18.8%. Similarly, the statistical analysis conducted on geographies consisting of 404,542,149 people shows a moderate positive correlation between the proportion of Guatemalans and poverty level among single females in the United States with a correlation coefficient (R) of 0.447 and weighted average of 23.8%, a difference of 26.9%.
Single Female Poverty Correlation Summary
| Measurement | Bulgarian | Guatemalan |
| Minimum | 5.0% | 12.4% |
| Maximum | 100.0% | 100.0% |
| Range | 95.0% | 87.6% |
| Mean | 22.4% | 33.7% |
| Median | 18.0% | 28.4% |
| Interquartile 25% (IQ1) | 14.8% | 23.4% |
| Interquartile 75% (IQ3) | 22.7% | 37.5% |
| Interquartile Range (IQR) | 7.9% | 14.1% |
| Standard Deviation (Sample) | 16.6% | 15.8% |
| Standard Deviation (Population) | 16.5% | 15.7% |
Similar Demographics by Single Female Poverty
Demographics Similar to Bulgarians by Single Female Poverty
In terms of single female poverty, the demographic groups most similar to Bulgarians are Tongan (18.8%, a difference of 0.030%), Okinawan (18.8%, a difference of 0.030%), Immigrants from Serbia (18.8%, a difference of 0.050%), Jordanian (18.8%, a difference of 0.13%), and Immigrants from Romania (18.8%, a difference of 0.28%).
| Demographics | Rating | Rank | Single Female Poverty |
| Immigrants | Sri Lanka | 99.9 /100 | #32 | Exceptional 18.6% |
| Immigrants | Philippines | 99.9 /100 | #33 | Exceptional 18.6% |
| Koreans | 99.9 /100 | #34 | Exceptional 18.6% |
| Immigrants | Japan | 99.9 /100 | #35 | Exceptional 18.6% |
| Turks | 99.9 /100 | #36 | Exceptional 18.7% |
| Immigrants | Armenia | 99.9 /100 | #37 | Exceptional 18.7% |
| Tongans | 99.9 /100 | #38 | Exceptional 18.8% |
| Bulgarians | 99.9 /100 | #39 | Exceptional 18.8% |
| Okinawans | 99.9 /100 | #40 | Exceptional 18.8% |
| Immigrants | Serbia | 99.9 /100 | #41 | Exceptional 18.8% |
| Jordanians | 99.9 /100 | #42 | Exceptional 18.8% |
| Immigrants | Romania | 99.9 /100 | #43 | Exceptional 18.8% |
| Immigrants | Croatia | 99.9 /100 | #44 | Exceptional 18.9% |
| Immigrants | Indonesia | 99.8 /100 | #45 | Exceptional 18.9% |
| Macedonians | 99.8 /100 | #46 | Exceptional 18.9% |
Demographics Similar to Guatemalans by Single Female Poverty
In terms of single female poverty, the demographic groups most similar to Guatemalans are Immigrants from Zaire (23.8%, a difference of 0.050%), German Russian (23.9%, a difference of 0.14%), Immigrants from Dominica (23.9%, a difference of 0.25%), Immigrants from Latin America (23.7%, a difference of 0.56%), and Alaskan Athabascan (23.6%, a difference of 1.1%).
| Demographics | Rating | Rank | Single Female Poverty |
| Mexican American Indians | 0.1 /100 | #275 | Tragic 23.4% |
| Immigrants | Azores | 0.0 /100 | #276 | Tragic 23.5% |
| Pennsylvania Germans | 0.0 /100 | #277 | Tragic 23.6% |
| Immigrants | Nonimmigrants | 0.0 /100 | #278 | Tragic 23.6% |
| Alaskan Athabascans | 0.0 /100 | #279 | Tragic 23.6% |
| Immigrants | Latin America | 0.0 /100 | #280 | Tragic 23.7% |
| Immigrants | Zaire | 0.0 /100 | #281 | Tragic 23.8% |
| Guatemalans | 0.0 /100 | #282 | Tragic 23.8% |
| German Russians | 0.0 /100 | #283 | Tragic 23.9% |
| Immigrants | Dominica | 0.0 /100 | #284 | Tragic 23.9% |
| Immigrants | Guatemala | 0.0 /100 | #285 | Tragic 24.1% |
| Cree | 0.0 /100 | #286 | Tragic 24.1% |
| Bangladeshis | 0.0 /100 | #287 | Tragic 24.2% |
| Spanish Americans | 0.0 /100 | #288 | Tragic 24.2% |
| U.S. Virgin Islanders | 0.0 /100 | #289 | Tragic 24.2% |