Crow vs Chippewa Family Poverty
COMPARE
Crow
Chippewa
Family Poverty
Family Poverty Comparison
Crow
Chippewa
16.1%
FAMILY POVERTY
0.0/ 100
METRIC RATING
338th/ 347
METRIC RANK
11.2%
FAMILY POVERTY
0.1/ 100
METRIC RATING
277th/ 347
METRIC RANK
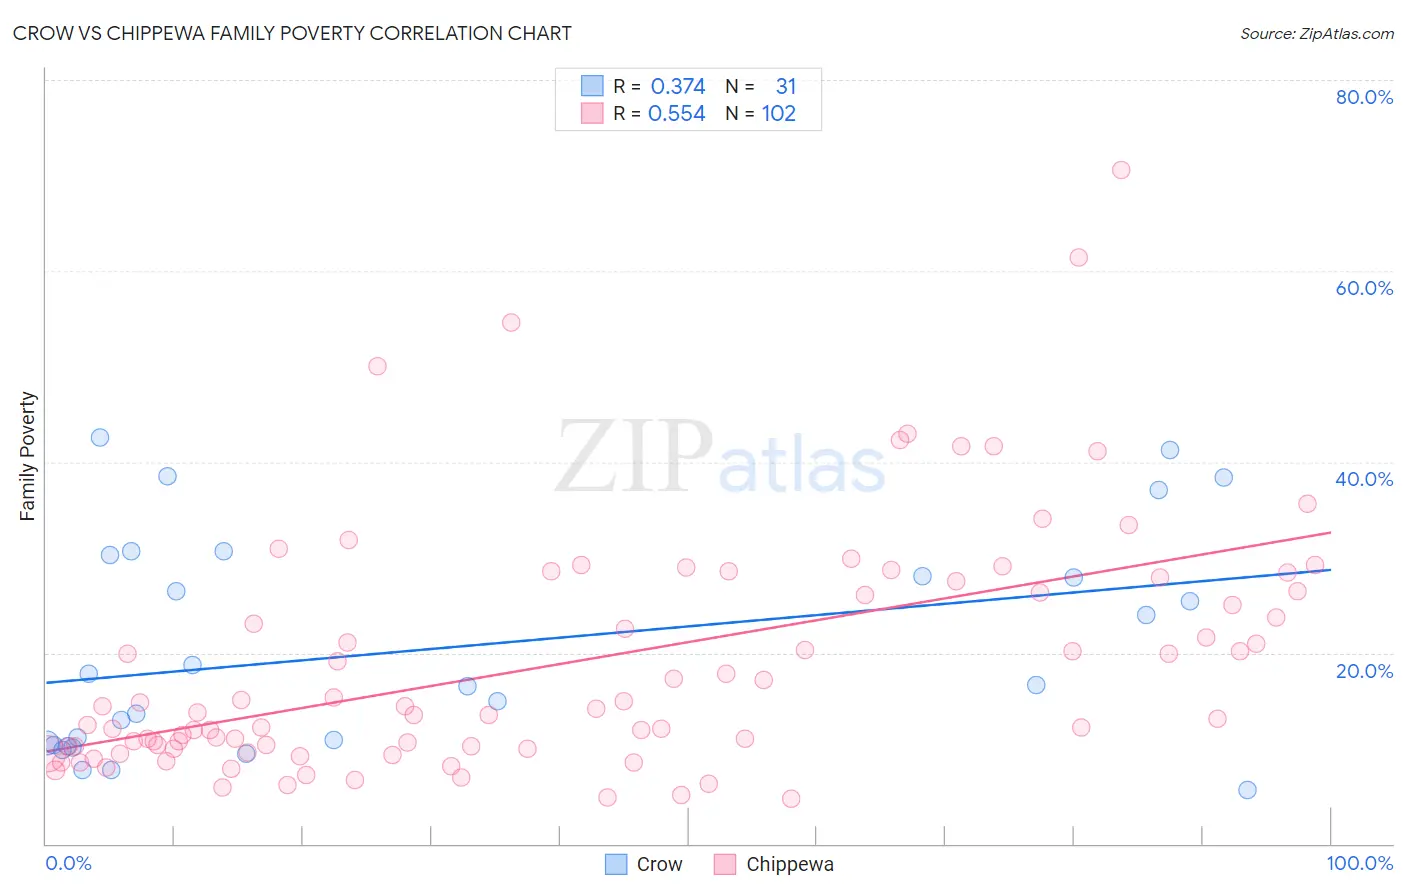
Crow vs Chippewa Family Poverty Correlation Chart
The statistical analysis conducted on geographies consisting of 59,176,312 people shows a mild positive correlation between the proportion of Crow and poverty level among families in the United States with a correlation coefficient (R) of 0.374 and weighted average of 16.1%. Similarly, the statistical analysis conducted on geographies consisting of 214,735,331 people shows a substantial positive correlation between the proportion of Chippewa and poverty level among families in the United States with a correlation coefficient (R) of 0.554 and weighted average of 11.2%, a difference of 43.3%.
Family Poverty Correlation Summary
| Measurement | Crow | Chippewa |
| Minimum | 5.7% | 4.7% |
| Maximum | 42.6% | 70.6% |
| Range | 36.9% | 65.9% |
| Mean | 20.5% | 19.0% |
| Median | 16.7% | 14.0% |
| Interquartile 25% (IQ1) | 10.4% | 10.2% |
| Interquartile 75% (IQ3) | 30.3% | 26.5% |
| Interquartile Range (IQR) | 19.9% | 16.3% |
| Standard Deviation (Sample) | 11.4% | 12.8% |
| Standard Deviation (Population) | 11.2% | 12.7% |
Similar Demographics by Family Poverty
Demographics Similar to Crow by Family Poverty
In terms of family poverty, the demographic groups most similar to Crow are Hopi (15.9%, a difference of 1.1%), Sioux (15.9%, a difference of 1.6%), Yuman (16.6%, a difference of 3.3%), Pueblo (17.0%, a difference of 5.4%), and Lumbee (17.0%, a difference of 5.5%).
| Demographics | Rating | Rank | Family Poverty |
| Cheyenne | 0.0 /100 | #331 | Tragic 14.3% |
| Dominicans | 0.0 /100 | #332 | Tragic 14.3% |
| Immigrants | Dominican Republic | 0.0 /100 | #333 | Tragic 14.4% |
| Houma | 0.0 /100 | #334 | Tragic 14.6% |
| Apache | 0.0 /100 | #335 | Tragic 14.7% |
| Sioux | 0.0 /100 | #336 | Tragic 15.9% |
| Hopi | 0.0 /100 | #337 | Tragic 15.9% |
| Crow | 0.0 /100 | #338 | Tragic 16.1% |
| Yuman | 0.0 /100 | #339 | Tragic 16.6% |
| Pueblo | 0.0 /100 | #340 | Tragic 17.0% |
| Lumbee | 0.0 /100 | #341 | Tragic 17.0% |
| Immigrants | Yemen | 0.0 /100 | #342 | Tragic 17.5% |
| Pima | 0.0 /100 | #343 | Tragic 18.4% |
| Yup'ik | 0.0 /100 | #344 | Tragic 18.7% |
| Navajo | 0.0 /100 | #345 | Tragic 18.8% |
Demographics Similar to Chippewa by Family Poverty
In terms of family poverty, the demographic groups most similar to Chippewa are Guyanese (11.2%, a difference of 0.030%), Immigrants from Guyana (11.2%, a difference of 0.090%), Central American (11.2%, a difference of 0.11%), Spanish American (11.2%, a difference of 0.16%), and Blackfeet (11.3%, a difference of 0.16%).
| Demographics | Rating | Rank | Family Poverty |
| Immigrants | Nicaragua | 0.1 /100 | #270 | Tragic 11.1% |
| Immigrants | Bahamas | 0.1 /100 | #271 | Tragic 11.1% |
| Immigrants | Jamaica | 0.1 /100 | #272 | Tragic 11.2% |
| Somalis | 0.1 /100 | #273 | Tragic 11.2% |
| Spanish Americans | 0.1 /100 | #274 | Tragic 11.2% |
| Central Americans | 0.1 /100 | #275 | Tragic 11.2% |
| Immigrants | Guyana | 0.1 /100 | #276 | Tragic 11.2% |
| Chippewa | 0.1 /100 | #277 | Tragic 11.2% |
| Guyanese | 0.1 /100 | #278 | Tragic 11.2% |
| Blackfeet | 0.0 /100 | #279 | Tragic 11.3% |
| Belizeans | 0.0 /100 | #280 | Tragic 11.3% |
| Immigrants | West Indies | 0.0 /100 | #281 | Tragic 11.3% |
| Immigrants | Cuba | 0.0 /100 | #282 | Tragic 11.3% |
| Indonesians | 0.0 /100 | #283 | Tragic 11.3% |
| Yaqui | 0.0 /100 | #284 | Tragic 11.3% |