Immigrants from Congo vs Chippewa Family Poverty
COMPARE
Immigrants from Congo
Chippewa
Family Poverty
Family Poverty Comparison
Immigrants from Congo
Chippewa
11.9%
FAMILY POVERTY
0.0/ 100
METRIC RATING
307th/ 347
METRIC RANK
11.2%
FAMILY POVERTY
0.1/ 100
METRIC RATING
277th/ 347
METRIC RANK
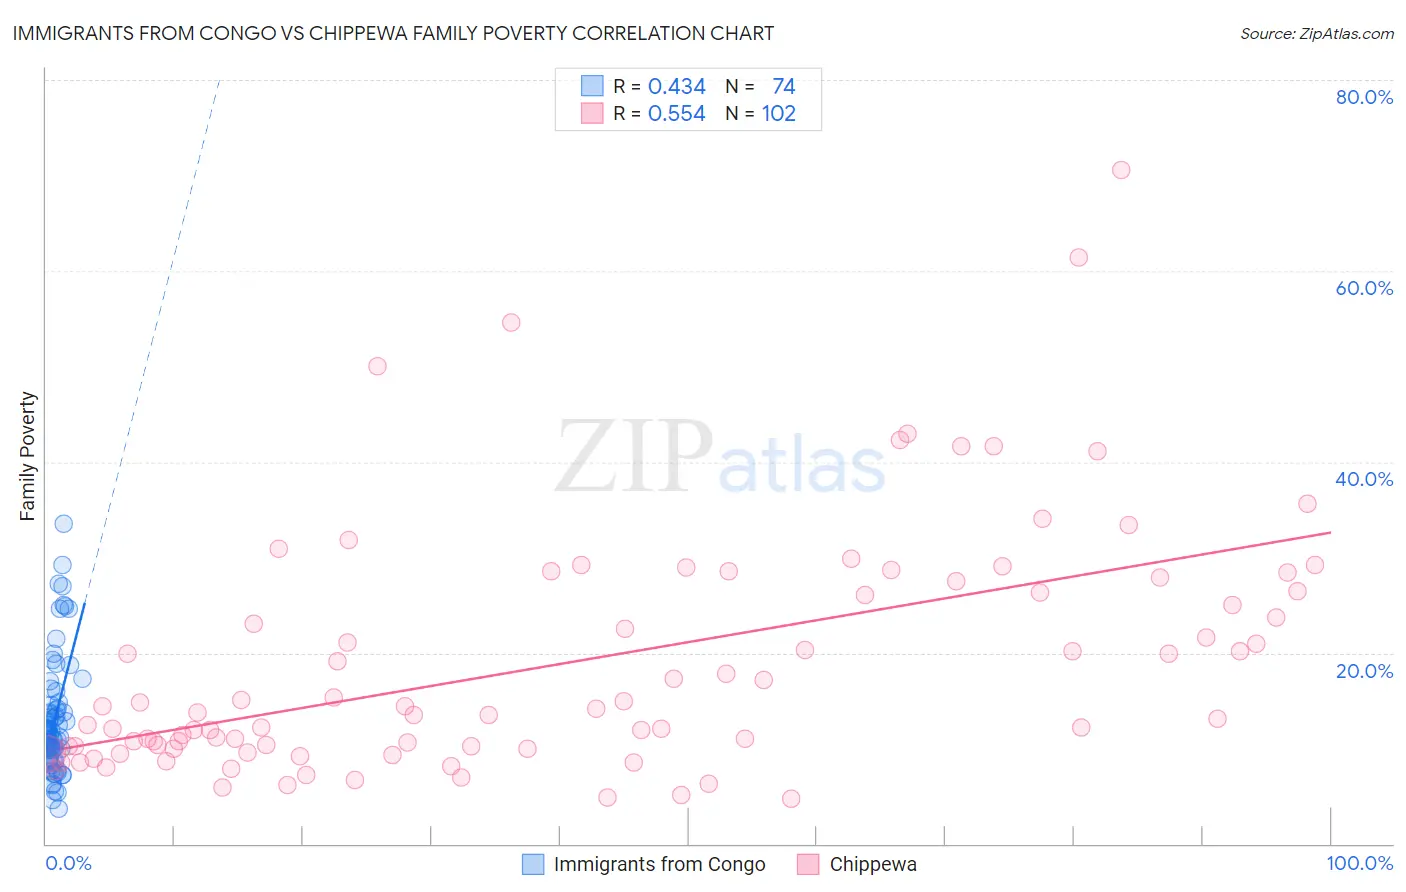
Immigrants from Congo vs Chippewa Family Poverty Correlation Chart
The statistical analysis conducted on geographies consisting of 92,062,434 people shows a moderate positive correlation between the proportion of Immigrants from Congo and poverty level among families in the United States with a correlation coefficient (R) of 0.434 and weighted average of 11.9%. Similarly, the statistical analysis conducted on geographies consisting of 214,735,331 people shows a substantial positive correlation between the proportion of Chippewa and poverty level among families in the United States with a correlation coefficient (R) of 0.554 and weighted average of 11.2%, a difference of 5.9%.
Family Poverty Correlation Summary
| Measurement | Immigrants from Congo | Chippewa |
| Minimum | 3.6% | 4.7% |
| Maximum | 33.5% | 70.6% |
| Range | 29.9% | 65.9% |
| Mean | 13.1% | 19.0% |
| Median | 11.6% | 14.0% |
| Interquartile 25% (IQ1) | 9.0% | 10.2% |
| Interquartile 75% (IQ3) | 14.5% | 26.5% |
| Interquartile Range (IQR) | 5.5% | 16.3% |
| Standard Deviation (Sample) | 6.1% | 12.8% |
| Standard Deviation (Population) | 6.1% | 12.7% |
Similar Demographics by Family Poverty
Demographics Similar to Immigrants from Congo by Family Poverty
In terms of family poverty, the demographic groups most similar to Immigrants from Congo are Seminole (11.9%, a difference of 0.060%), Cajun (11.9%, a difference of 0.11%), Hispanic or Latino (12.0%, a difference of 0.50%), Immigrants from Guatemala (12.0%, a difference of 0.51%), and Mexican (11.8%, a difference of 0.67%).
| Demographics | Rating | Rank | Family Poverty |
| Immigrants | Bangladesh | 0.0 /100 | #300 | Tragic 11.7% |
| Bahamians | 0.0 /100 | #301 | Tragic 11.7% |
| Guatemalans | 0.0 /100 | #302 | Tragic 11.7% |
| Africans | 0.0 /100 | #303 | Tragic 11.8% |
| Immigrants | Latin America | 0.0 /100 | #304 | Tragic 11.8% |
| Mexicans | 0.0 /100 | #305 | Tragic 11.8% |
| Cajuns | 0.0 /100 | #306 | Tragic 11.9% |
| Immigrants | Congo | 0.0 /100 | #307 | Tragic 11.9% |
| Seminole | 0.0 /100 | #308 | Tragic 11.9% |
| Hispanics or Latinos | 0.0 /100 | #309 | Tragic 12.0% |
| Immigrants | Guatemala | 0.0 /100 | #310 | Tragic 12.0% |
| Ute | 0.0 /100 | #311 | Tragic 12.1% |
| Immigrants | Central America | 0.0 /100 | #312 | Tragic 12.1% |
| Immigrants | Caribbean | 0.0 /100 | #313 | Tragic 12.2% |
| Kiowa | 0.0 /100 | #314 | Tragic 12.2% |
Demographics Similar to Chippewa by Family Poverty
In terms of family poverty, the demographic groups most similar to Chippewa are Guyanese (11.2%, a difference of 0.030%), Immigrants from Guyana (11.2%, a difference of 0.090%), Central American (11.2%, a difference of 0.11%), Spanish American (11.2%, a difference of 0.16%), and Blackfeet (11.3%, a difference of 0.16%).
| Demographics | Rating | Rank | Family Poverty |
| Immigrants | Nicaragua | 0.1 /100 | #270 | Tragic 11.1% |
| Immigrants | Bahamas | 0.1 /100 | #271 | Tragic 11.1% |
| Immigrants | Jamaica | 0.1 /100 | #272 | Tragic 11.2% |
| Somalis | 0.1 /100 | #273 | Tragic 11.2% |
| Spanish Americans | 0.1 /100 | #274 | Tragic 11.2% |
| Central Americans | 0.1 /100 | #275 | Tragic 11.2% |
| Immigrants | Guyana | 0.1 /100 | #276 | Tragic 11.2% |
| Chippewa | 0.1 /100 | #277 | Tragic 11.2% |
| Guyanese | 0.1 /100 | #278 | Tragic 11.2% |
| Blackfeet | 0.0 /100 | #279 | Tragic 11.3% |
| Belizeans | 0.0 /100 | #280 | Tragic 11.3% |
| Immigrants | West Indies | 0.0 /100 | #281 | Tragic 11.3% |
| Immigrants | Cuba | 0.0 /100 | #282 | Tragic 11.3% |
| Indonesians | 0.0 /100 | #283 | Tragic 11.3% |
| Yaqui | 0.0 /100 | #284 | Tragic 11.3% |