Immigrants from Ghana vs Chippewa Family Poverty
COMPARE
Immigrants from Ghana
Chippewa
Family Poverty
Family Poverty Comparison
Immigrants from Ghana
Chippewa
10.8%
FAMILY POVERTY
0.2/ 100
METRIC RATING
257th/ 347
METRIC RANK
11.2%
FAMILY POVERTY
0.1/ 100
METRIC RATING
277th/ 347
METRIC RANK
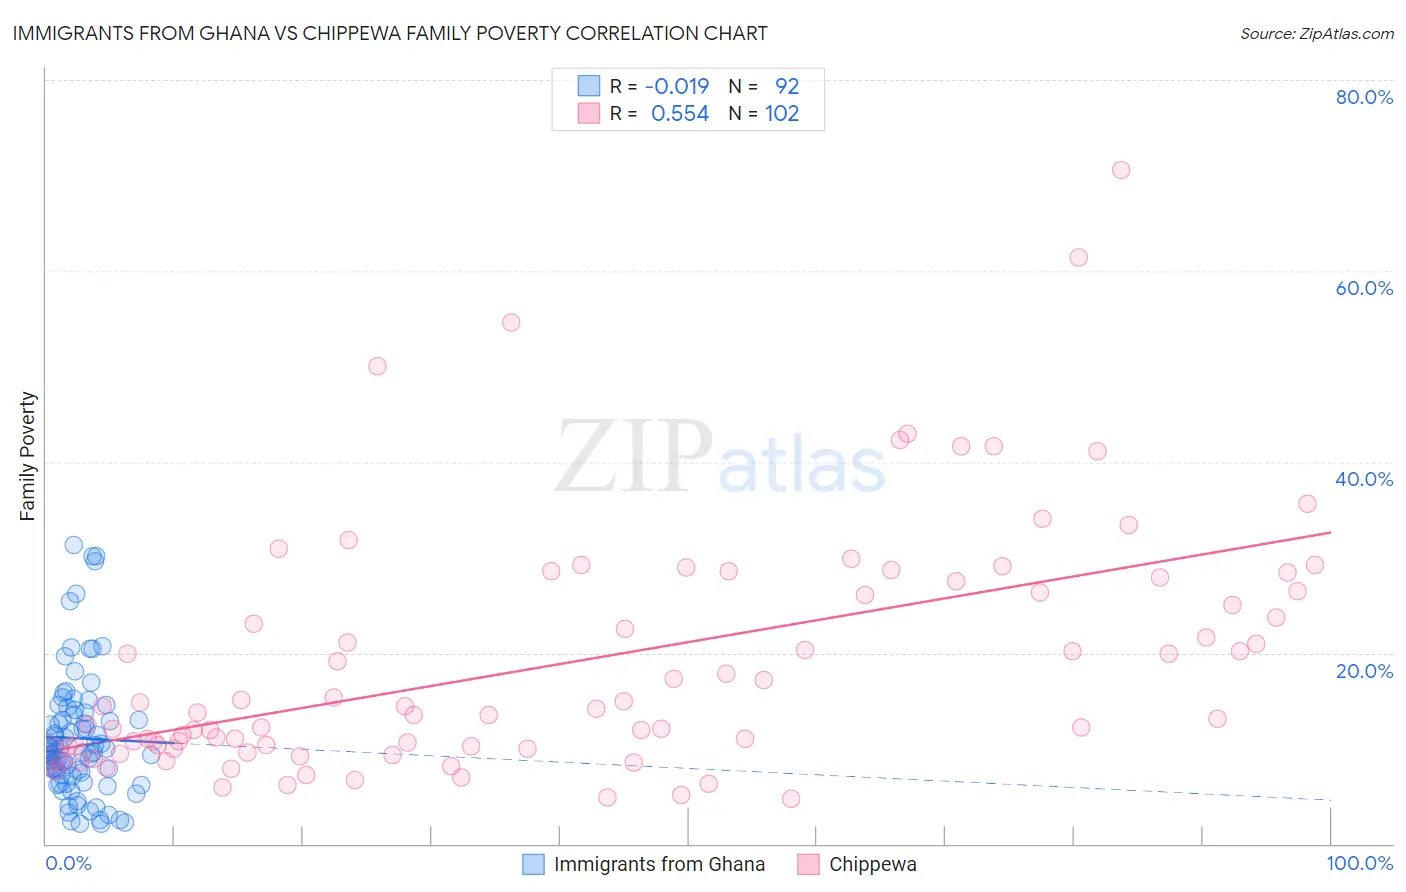
Immigrants from Ghana vs Chippewa Family Poverty Correlation Chart
The statistical analysis conducted on geographies consisting of 199,614,936 people shows no correlation between the proportion of Immigrants from Ghana and poverty level among families in the United States with a correlation coefficient (R) of -0.019 and weighted average of 10.8%. Similarly, the statistical analysis conducted on geographies consisting of 214,735,331 people shows a substantial positive correlation between the proportion of Chippewa and poverty level among families in the United States with a correlation coefficient (R) of 0.554 and weighted average of 11.2%, a difference of 3.6%.
Family Poverty Correlation Summary
| Measurement | Immigrants from Ghana | Chippewa |
| Minimum | 2.0% | 4.7% |
| Maximum | 31.3% | 70.6% |
| Range | 29.3% | 65.9% |
| Mean | 11.0% | 19.0% |
| Median | 9.6% | 14.0% |
| Interquartile 25% (IQ1) | 7.1% | 10.2% |
| Interquartile 75% (IQ3) | 13.6% | 26.5% |
| Interquartile Range (IQR) | 6.5% | 16.3% |
| Standard Deviation (Sample) | 6.5% | 12.8% |
| Standard Deviation (Population) | 6.5% | 12.7% |
Demographics Similar to Immigrants from Ghana and Chippewa by Family Poverty
In terms of family poverty, the demographic groups most similar to Immigrants from Ghana are Subsaharan African (10.9%, a difference of 0.030%), Mexican American Indian (10.9%, a difference of 0.070%), Bangladeshi (10.9%, a difference of 0.42%), Shoshone (10.9%, a difference of 0.46%), and Spanish American Indian (10.9%, a difference of 0.59%). Similarly, the demographic groups most similar to Chippewa are Immigrants from Guyana (11.2%, a difference of 0.090%), Central American (11.2%, a difference of 0.11%), Spanish American (11.2%, a difference of 0.16%), Somali (11.2%, a difference of 0.25%), and Immigrants from Jamaica (11.2%, a difference of 0.76%).
| Demographics | Rating | Rank | Family Poverty |
| Immigrants | Ghana | 0.2 /100 | #257 | Tragic 10.8% |
| Sub-Saharan Africans | 0.2 /100 | #258 | Tragic 10.9% |
| Mexican American Indians | 0.2 /100 | #259 | Tragic 10.9% |
| Bangladeshis | 0.2 /100 | #260 | Tragic 10.9% |
| Shoshone | 0.2 /100 | #261 | Tragic 10.9% |
| Spanish American Indians | 0.2 /100 | #262 | Tragic 10.9% |
| Cape Verdeans | 0.1 /100 | #263 | Tragic 10.9% |
| Trinidadians and Tobagonians | 0.1 /100 | #264 | Tragic 10.9% |
| Immigrants | Trinidad and Tobago | 0.1 /100 | #265 | Tragic 10.9% |
| Immigrants | El Salvador | 0.1 /100 | #266 | Tragic 11.0% |
| Comanche | 0.1 /100 | #267 | Tragic 11.0% |
| Jamaicans | 0.1 /100 | #268 | Tragic 11.1% |
| Immigrants | Ecuador | 0.1 /100 | #269 | Tragic 11.1% |
| Immigrants | Nicaragua | 0.1 /100 | #270 | Tragic 11.1% |
| Immigrants | Bahamas | 0.1 /100 | #271 | Tragic 11.1% |
| Immigrants | Jamaica | 0.1 /100 | #272 | Tragic 11.2% |
| Somalis | 0.1 /100 | #273 | Tragic 11.2% |
| Spanish Americans | 0.1 /100 | #274 | Tragic 11.2% |
| Central Americans | 0.1 /100 | #275 | Tragic 11.2% |
| Immigrants | Guyana | 0.1 /100 | #276 | Tragic 11.2% |
| Chippewa | 0.1 /100 | #277 | Tragic 11.2% |