Immigrants from North Macedonia vs Chippewa Family Poverty
COMPARE
Immigrants from North Macedonia
Chippewa
Family Poverty
Family Poverty Comparison
Immigrants from North Macedonia
Chippewa
7.7%
FAMILY POVERTY
98.9/ 100
METRIC RATING
50th/ 347
METRIC RANK
11.2%
FAMILY POVERTY
0.1/ 100
METRIC RATING
277th/ 347
METRIC RANK
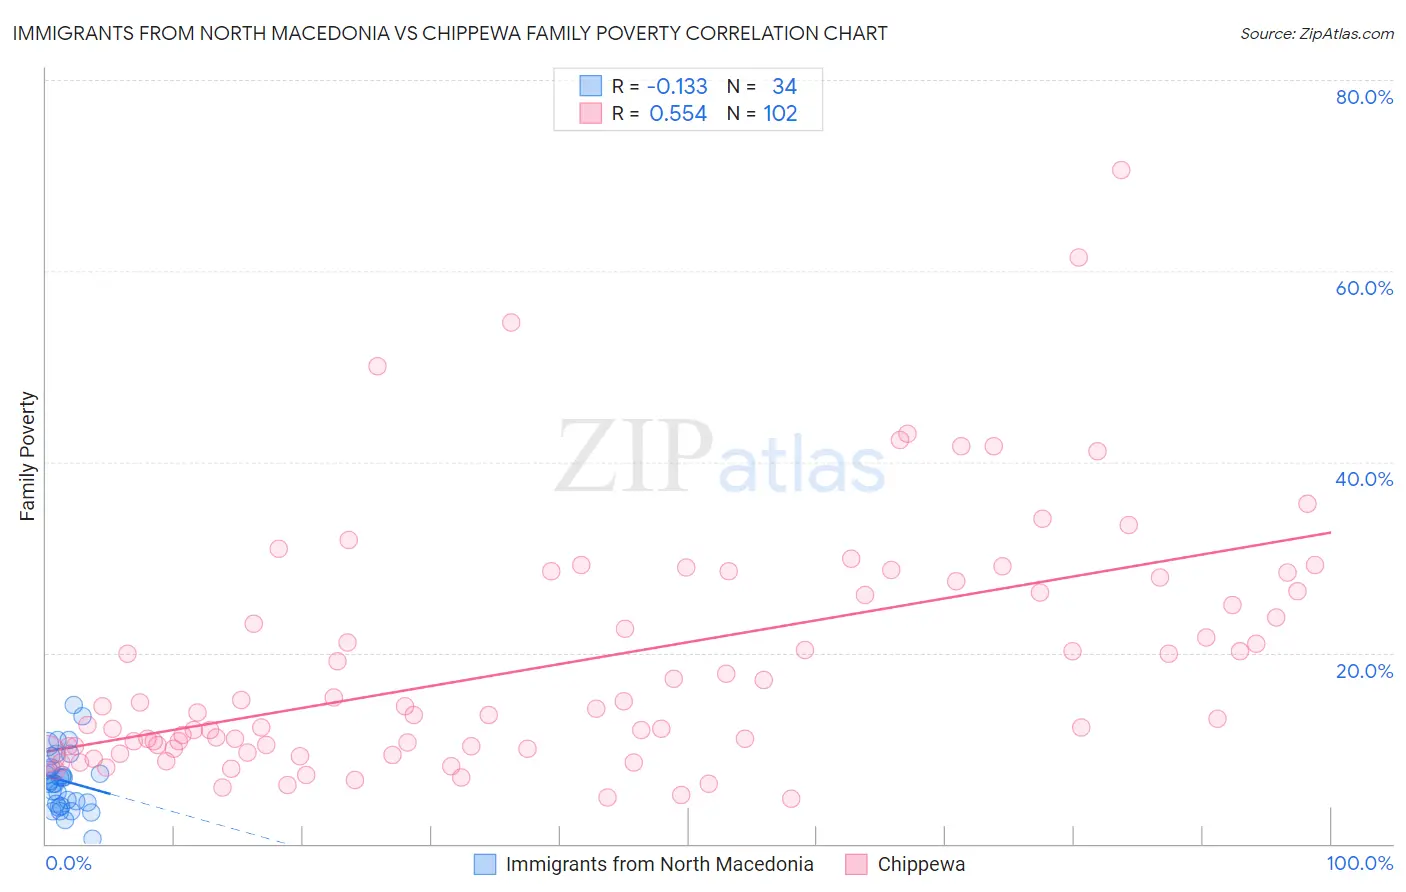
Immigrants from North Macedonia vs Chippewa Family Poverty Correlation Chart
The statistical analysis conducted on geographies consisting of 74,220,481 people shows a poor negative correlation between the proportion of Immigrants from North Macedonia and poverty level among families in the United States with a correlation coefficient (R) of -0.133 and weighted average of 7.7%. Similarly, the statistical analysis conducted on geographies consisting of 214,735,331 people shows a substantial positive correlation between the proportion of Chippewa and poverty level among families in the United States with a correlation coefficient (R) of 0.554 and weighted average of 11.2%, a difference of 46.2%.
Family Poverty Correlation Summary
| Measurement | Immigrants from North Macedonia | Chippewa |
| Minimum | 0.51% | 4.7% |
| Maximum | 14.6% | 70.6% |
| Range | 14.0% | 65.9% |
| Mean | 6.6% | 19.0% |
| Median | 6.4% | 14.0% |
| Interquartile 25% (IQ1) | 4.3% | 10.2% |
| Interquartile 75% (IQ3) | 8.0% | 26.5% |
| Interquartile Range (IQR) | 3.7% | 16.3% |
| Standard Deviation (Sample) | 3.1% | 12.8% |
| Standard Deviation (Population) | 3.1% | 12.7% |
Similar Demographics by Family Poverty
Demographics Similar to Immigrants from North Macedonia by Family Poverty
In terms of family poverty, the demographic groups most similar to Immigrants from North Macedonia are Immigrants from Bolivia (7.7%, a difference of 0.030%), Immigrants from Moldova (7.7%, a difference of 0.15%), Immigrants from Sri Lanka (7.7%, a difference of 0.22%), Immigrants from Czechoslovakia (7.7%, a difference of 0.23%), and Tongan (7.7%, a difference of 0.25%).
| Demographics | Rating | Rank | Family Poverty |
| Immigrants | Austria | 99.1 /100 | #43 | Exceptional 7.6% |
| Germans | 99.0 /100 | #44 | Exceptional 7.7% |
| Okinawans | 98.9 /100 | #45 | Exceptional 7.7% |
| Tongans | 98.9 /100 | #46 | Exceptional 7.7% |
| Immigrants | Czechoslovakia | 98.9 /100 | #47 | Exceptional 7.7% |
| Immigrants | Sri Lanka | 98.9 /100 | #48 | Exceptional 7.7% |
| Immigrants | Bolivia | 98.9 /100 | #49 | Exceptional 7.7% |
| Immigrants | North Macedonia | 98.9 /100 | #50 | Exceptional 7.7% |
| Immigrants | Moldova | 98.8 /100 | #51 | Exceptional 7.7% |
| Indians (Asian) | 98.8 /100 | #52 | Exceptional 7.7% |
| Swiss | 98.8 /100 | #53 | Exceptional 7.7% |
| Immigrants | Sweden | 98.8 /100 | #54 | Exceptional 7.7% |
| Immigrants | Eastern Asia | 98.7 /100 | #55 | Exceptional 7.7% |
| Immigrants | Serbia | 98.7 /100 | #56 | Exceptional 7.7% |
| Asians | 98.7 /100 | #57 | Exceptional 7.7% |
Demographics Similar to Chippewa by Family Poverty
In terms of family poverty, the demographic groups most similar to Chippewa are Guyanese (11.2%, a difference of 0.030%), Immigrants from Guyana (11.2%, a difference of 0.090%), Central American (11.2%, a difference of 0.11%), Spanish American (11.2%, a difference of 0.16%), and Blackfeet (11.3%, a difference of 0.16%).
| Demographics | Rating | Rank | Family Poverty |
| Immigrants | Nicaragua | 0.1 /100 | #270 | Tragic 11.1% |
| Immigrants | Bahamas | 0.1 /100 | #271 | Tragic 11.1% |
| Immigrants | Jamaica | 0.1 /100 | #272 | Tragic 11.2% |
| Somalis | 0.1 /100 | #273 | Tragic 11.2% |
| Spanish Americans | 0.1 /100 | #274 | Tragic 11.2% |
| Central Americans | 0.1 /100 | #275 | Tragic 11.2% |
| Immigrants | Guyana | 0.1 /100 | #276 | Tragic 11.2% |
| Chippewa | 0.1 /100 | #277 | Tragic 11.2% |
| Guyanese | 0.1 /100 | #278 | Tragic 11.2% |
| Blackfeet | 0.0 /100 | #279 | Tragic 11.3% |
| Belizeans | 0.0 /100 | #280 | Tragic 11.3% |
| Immigrants | West Indies | 0.0 /100 | #281 | Tragic 11.3% |
| Immigrants | Cuba | 0.0 /100 | #282 | Tragic 11.3% |
| Indonesians | 0.0 /100 | #283 | Tragic 11.3% |
| Yaqui | 0.0 /100 | #284 | Tragic 11.3% |