Crow vs Chippewa Disability Age 35 to 64
COMPARE
Crow
Chippewa
Disability Age 35 to 64
Disability Age 35 to 64 Comparison
Crow
Chippewa
14.6%
DISABILITY AGE 35 TO 64
0.0/ 100
METRIC RATING
317th/ 347
METRIC RANK
15.0%
DISABILITY AGE 35 TO 64
0.0/ 100
METRIC RATING
324th/ 347
METRIC RANK
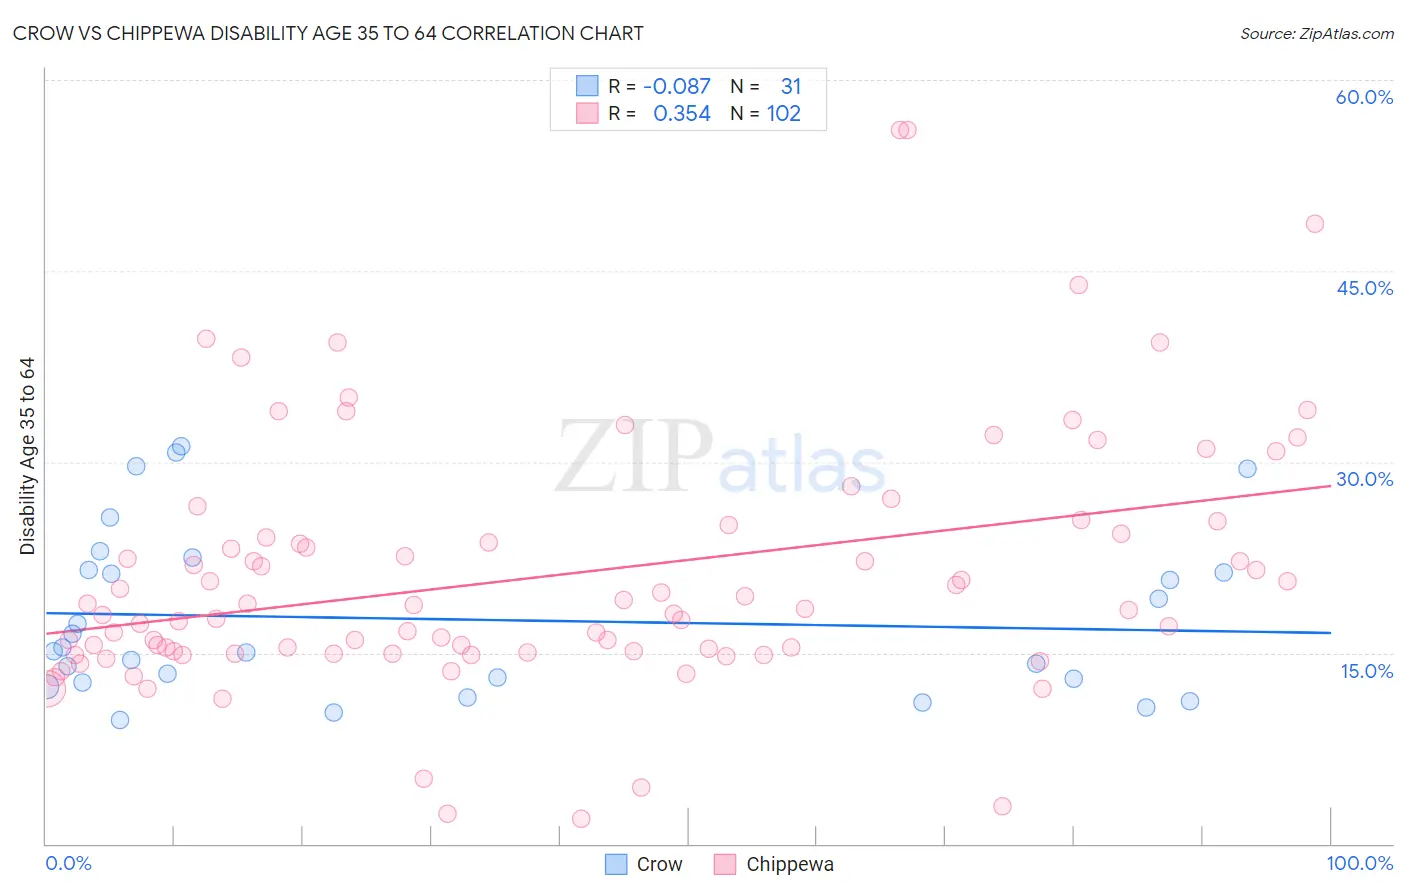
Crow vs Chippewa Disability Age 35 to 64 Correlation Chart
The statistical analysis conducted on geographies consisting of 59,202,172 people shows a slight negative correlation between the proportion of Crow and percentage of population with a disability between the ages 34 and 64 in the United States with a correlation coefficient (R) of -0.087 and weighted average of 14.6%. Similarly, the statistical analysis conducted on geographies consisting of 214,987,125 people shows a mild positive correlation between the proportion of Chippewa and percentage of population with a disability between the ages 34 and 64 in the United States with a correlation coefficient (R) of 0.354 and weighted average of 15.0%, a difference of 2.4%.
Disability Age 35 to 64 Correlation Summary
| Measurement | Crow | Chippewa |
| Minimum | 9.7% | 2.0% |
| Maximum | 31.2% | 56.1% |
| Range | 21.5% | 54.1% |
| Mean | 17.6% | 21.1% |
| Median | 15.1% | 18.4% |
| Interquartile 25% (IQ1) | 12.6% | 15.0% |
| Interquartile 75% (IQ3) | 21.5% | 24.3% |
| Interquartile Range (IQR) | 8.9% | 9.3% |
| Standard Deviation (Sample) | 6.5% | 10.0% |
| Standard Deviation (Population) | 6.4% | 9.9% |
Demographics Similar to Crow and Chippewa by Disability Age 35 to 64
In terms of disability age 35 to 64, the demographic groups most similar to Crow are Ottawa (14.6%, a difference of 0.070%), Immigrants from Cabo Verde (14.7%, a difference of 0.49%), Black/African American (14.7%, a difference of 0.64%), Osage (14.5%, a difference of 0.87%), and Comanche (14.7%, a difference of 0.90%). Similarly, the demographic groups most similar to Chippewa are Apache (14.9%, a difference of 0.20%), Arapaho (15.1%, a difference of 0.66%), Potawatomi (14.8%, a difference of 1.4%), Comanche (14.7%, a difference of 1.5%), and Black/African American (14.7%, a difference of 1.7%).
| Demographics | Rating | Rank | Disability Age 35 to 64 |
| Cape Verdeans | 0.0 /100 | #310 | Tragic 14.1% |
| Immigrants | Azores | 0.0 /100 | #311 | Tragic 14.3% |
| Paiute | 0.0 /100 | #312 | Tragic 14.3% |
| Iroquois | 0.0 /100 | #313 | Tragic 14.4% |
| Shoshone | 0.0 /100 | #314 | Tragic 14.5% |
| Alaska Natives | 0.0 /100 | #315 | Tragic 14.5% |
| Osage | 0.0 /100 | #316 | Tragic 14.5% |
| Crow | 0.0 /100 | #317 | Tragic 14.6% |
| Ottawa | 0.0 /100 | #318 | Tragic 14.6% |
| Immigrants | Cabo Verde | 0.0 /100 | #319 | Tragic 14.7% |
| Blacks/African Americans | 0.0 /100 | #320 | Tragic 14.7% |
| Comanche | 0.0 /100 | #321 | Tragic 14.7% |
| Potawatomi | 0.0 /100 | #322 | Tragic 14.8% |
| Apache | 0.0 /100 | #323 | Tragic 14.9% |
| Chippewa | 0.0 /100 | #324 | Tragic 15.0% |
| Arapaho | 0.0 /100 | #325 | Tragic 15.1% |
| Natives/Alaskans | 0.0 /100 | #326 | Tragic 15.3% |
| Pueblo | 0.0 /100 | #327 | Tragic 15.3% |
| Cajuns | 0.0 /100 | #328 | Tragic 15.3% |
| Cherokee | 0.0 /100 | #329 | Tragic 15.5% |
| Navajo | 0.0 /100 | #330 | Tragic 15.5% |