Crow vs Immigrants from Greece Family Poverty
COMPARE
Crow
Immigrants from Greece
Family Poverty
Family Poverty Comparison
Crow
Immigrants from Greece
16.1%
FAMILY POVERTY
0.0/ 100
METRIC RATING
338th/ 347
METRIC RANK
7.7%
FAMILY POVERTY
98.7/ 100
METRIC RATING
60th/ 347
METRIC RANK
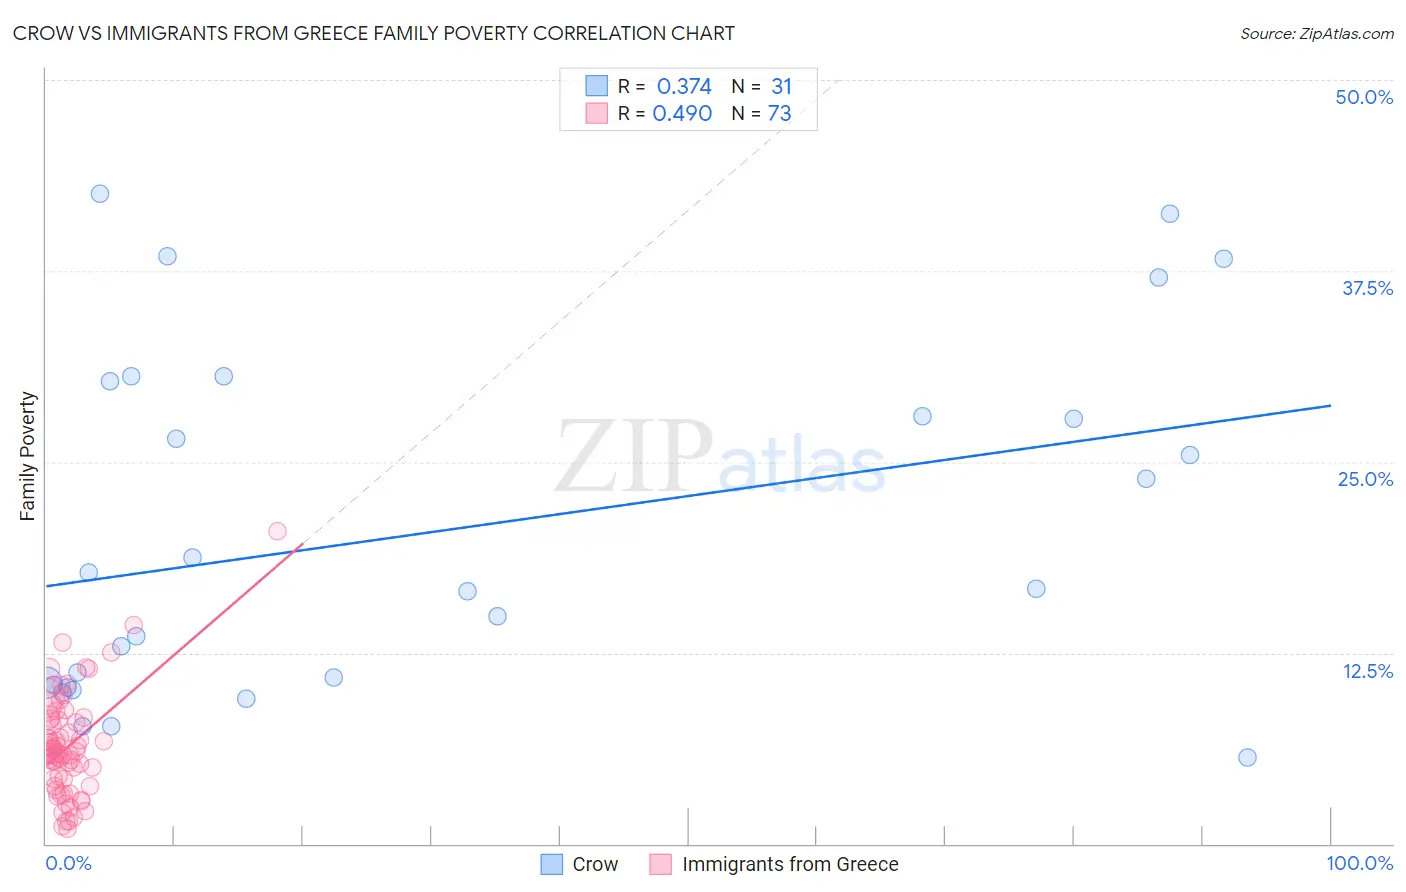
Crow vs Immigrants from Greece Family Poverty Correlation Chart
The statistical analysis conducted on geographies consisting of 59,176,312 people shows a mild positive correlation between the proportion of Crow and poverty level among families in the United States with a correlation coefficient (R) of 0.374 and weighted average of 16.1%. Similarly, the statistical analysis conducted on geographies consisting of 216,555,075 people shows a moderate positive correlation between the proportion of Immigrants from Greece and poverty level among families in the United States with a correlation coefficient (R) of 0.490 and weighted average of 7.7%, a difference of 108.3%.
Family Poverty Correlation Summary
| Measurement | Crow | Immigrants from Greece |
| Minimum | 5.7% | 0.99% |
| Maximum | 42.6% | 20.5% |
| Range | 36.9% | 19.5% |
| Mean | 20.5% | 6.4% |
| Median | 16.7% | 6.0% |
| Interquartile 25% (IQ1) | 10.4% | 4.0% |
| Interquartile 75% (IQ3) | 30.3% | 8.1% |
| Interquartile Range (IQR) | 19.9% | 4.1% |
| Standard Deviation (Sample) | 11.4% | 3.4% |
| Standard Deviation (Population) | 11.2% | 3.4% |
Similar Demographics by Family Poverty
Demographics Similar to Crow by Family Poverty
In terms of family poverty, the demographic groups most similar to Crow are Hopi (15.9%, a difference of 1.1%), Sioux (15.9%, a difference of 1.6%), Yuman (16.6%, a difference of 3.3%), Pueblo (17.0%, a difference of 5.4%), and Lumbee (17.0%, a difference of 5.5%).
| Demographics | Rating | Rank | Family Poverty |
| Cheyenne | 0.0 /100 | #331 | Tragic 14.3% |
| Dominicans | 0.0 /100 | #332 | Tragic 14.3% |
| Immigrants | Dominican Republic | 0.0 /100 | #333 | Tragic 14.4% |
| Houma | 0.0 /100 | #334 | Tragic 14.6% |
| Apache | 0.0 /100 | #335 | Tragic 14.7% |
| Sioux | 0.0 /100 | #336 | Tragic 15.9% |
| Hopi | 0.0 /100 | #337 | Tragic 15.9% |
| Crow | 0.0 /100 | #338 | Tragic 16.1% |
| Yuman | 0.0 /100 | #339 | Tragic 16.6% |
| Pueblo | 0.0 /100 | #340 | Tragic 17.0% |
| Lumbee | 0.0 /100 | #341 | Tragic 17.0% |
| Immigrants | Yemen | 0.0 /100 | #342 | Tragic 17.5% |
| Pima | 0.0 /100 | #343 | Tragic 18.4% |
| Yup'ik | 0.0 /100 | #344 | Tragic 18.7% |
| Navajo | 0.0 /100 | #345 | Tragic 18.8% |
Demographics Similar to Immigrants from Greece by Family Poverty
In terms of family poverty, the demographic groups most similar to Immigrants from Greece are European (7.7%, a difference of 0.010%), Finnish (7.7%, a difference of 0.020%), Asian (7.7%, a difference of 0.050%), Immigrants from Serbia (7.7%, a difference of 0.14%), and Immigrants from Eastern Asia (7.7%, a difference of 0.18%).
| Demographics | Rating | Rank | Family Poverty |
| Swiss | 98.8 /100 | #53 | Exceptional 7.7% |
| Immigrants | Sweden | 98.8 /100 | #54 | Exceptional 7.7% |
| Immigrants | Eastern Asia | 98.7 /100 | #55 | Exceptional 7.7% |
| Immigrants | Serbia | 98.7 /100 | #56 | Exceptional 7.7% |
| Asians | 98.7 /100 | #57 | Exceptional 7.7% |
| Finns | 98.7 /100 | #58 | Exceptional 7.7% |
| Europeans | 98.7 /100 | #59 | Exceptional 7.7% |
| Immigrants | Greece | 98.7 /100 | #60 | Exceptional 7.7% |
| Immigrants | Netherlands | 98.6 /100 | #61 | Exceptional 7.7% |
| Macedonians | 98.6 /100 | #62 | Exceptional 7.8% |
| Zimbabweans | 98.4 /100 | #63 | Exceptional 7.8% |
| Koreans | 98.3 /100 | #64 | Exceptional 7.8% |
| Immigrants | Bulgaria | 98.3 /100 | #65 | Exceptional 7.8% |
| Dutch | 98.3 /100 | #66 | Exceptional 7.8% |
| Northern Europeans | 98.3 /100 | #67 | Exceptional 7.8% |