Immigrants from Belgium vs Immigrants from Singapore Single Mother Poverty
COMPARE
Immigrants from Belgium
Immigrants from Singapore
Single Mother Poverty
Single Mother Poverty Comparison
Immigrants from Belgium
Immigrants from Singapore
28.5%
SINGLE MOTHER POVERTY
88.5/ 100
METRIC RATING
138th/ 347
METRIC RANK
25.8%
SINGLE MOTHER POVERTY
100.0/ 100
METRIC RATING
14th/ 347
METRIC RANK
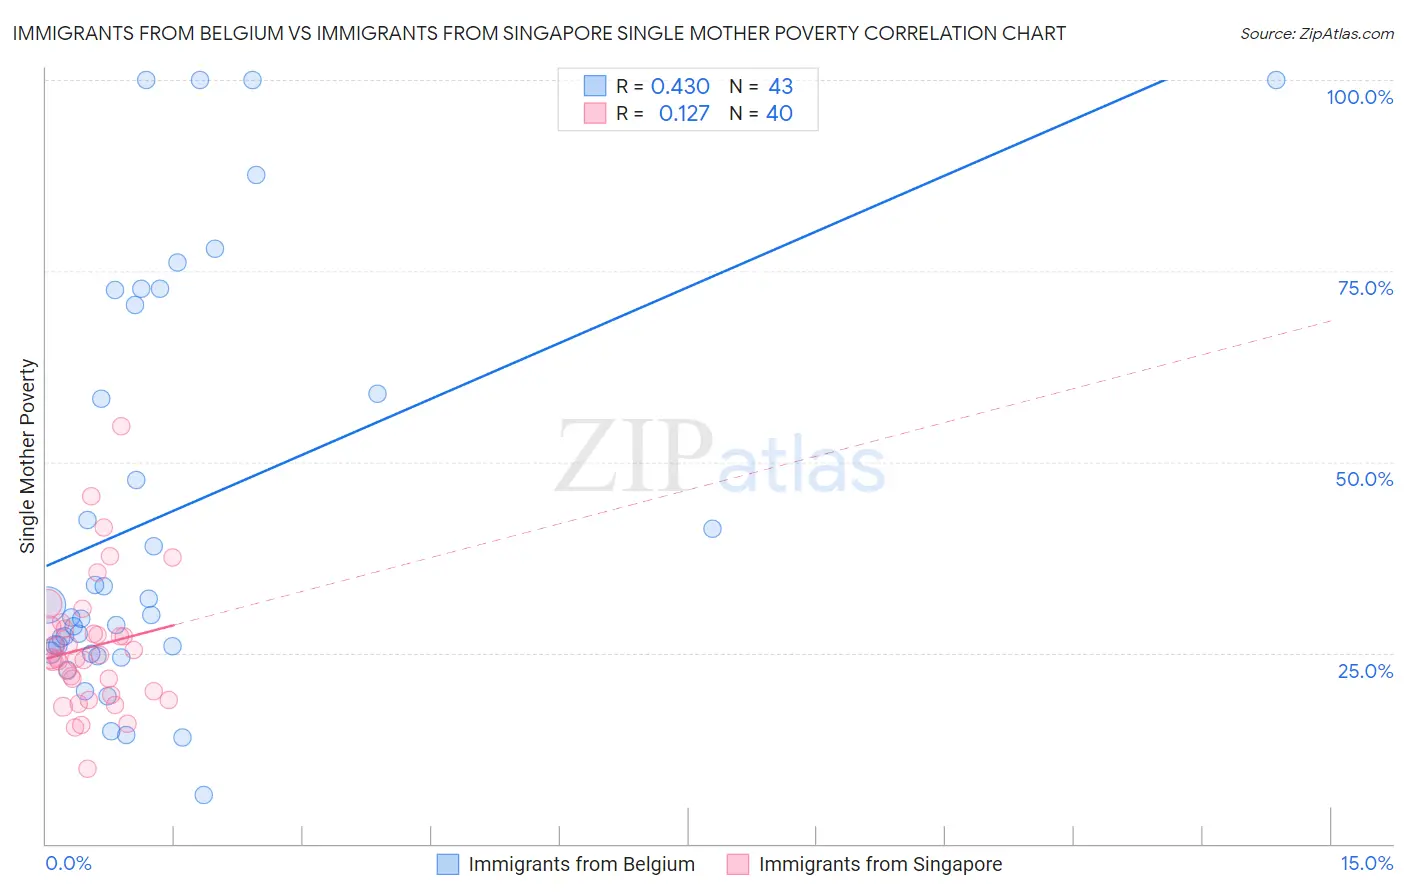
Immigrants from Belgium vs Immigrants from Singapore Single Mother Poverty Correlation Chart
The statistical analysis conducted on geographies consisting of 144,308,237 people shows a moderate positive correlation between the proportion of Immigrants from Belgium and poverty level among single mothers in the United States with a correlation coefficient (R) of 0.430 and weighted average of 28.5%. Similarly, the statistical analysis conducted on geographies consisting of 135,231,520 people shows a poor positive correlation between the proportion of Immigrants from Singapore and poverty level among single mothers in the United States with a correlation coefficient (R) of 0.127 and weighted average of 25.8%, a difference of 10.3%.
Single Mother Poverty Correlation Summary
| Measurement | Immigrants from Belgium | Immigrants from Singapore |
| Minimum | 6.3% | 9.9% |
| Maximum | 100.0% | 54.7% |
| Range | 93.7% | 44.8% |
| Mean | 43.3% | 25.8% |
| Median | 30.0% | 24.2% |
| Interquartile 25% (IQ1) | 25.0% | 19.7% |
| Interquartile 75% (IQ3) | 70.5% | 28.2% |
| Interquartile Range (IQR) | 45.5% | 8.5% |
| Standard Deviation (Sample) | 27.1% | 8.7% |
| Standard Deviation (Population) | 26.8% | 8.5% |
Similar Demographics by Single Mother Poverty
Demographics Similar to Immigrants from Belgium by Single Mother Poverty
In terms of single mother poverty, the demographic groups most similar to Immigrants from Belgium are Native Hawaiian (28.4%, a difference of 0.050%), Immigrants from Canada (28.4%, a difference of 0.050%), Samoan (28.5%, a difference of 0.050%), Immigrants from Colombia (28.5%, a difference of 0.060%), and Immigrants from Southern Europe (28.4%, a difference of 0.090%).
| Demographics | Rating | Rank | Single Mother Poverty |
| Immigrants | Austria | 90.3 /100 | #131 | Exceptional 28.4% |
| Immigrants | Morocco | 89.5 /100 | #132 | Excellent 28.4% |
| Swedes | 89.4 /100 | #133 | Excellent 28.4% |
| Immigrants | Southern Europe | 89.2 /100 | #134 | Excellent 28.4% |
| Immigrants | Spain | 89.2 /100 | #135 | Excellent 28.4% |
| Native Hawaiians | 88.9 /100 | #136 | Excellent 28.4% |
| Immigrants | Canada | 88.9 /100 | #137 | Excellent 28.4% |
| Immigrants | Belgium | 88.5 /100 | #138 | Excellent 28.5% |
| Samoans | 88.1 /100 | #139 | Excellent 28.5% |
| Immigrants | Colombia | 88.0 /100 | #140 | Excellent 28.5% |
| Danes | 87.1 /100 | #141 | Excellent 28.5% |
| South Africans | 86.6 /100 | #142 | Excellent 28.5% |
| Immigrants | North America | 86.5 /100 | #143 | Excellent 28.5% |
| Luxembourgers | 86.4 /100 | #144 | Excellent 28.5% |
| Immigrants | South America | 86.1 /100 | #145 | Excellent 28.5% |
Demographics Similar to Immigrants from Singapore by Single Mother Poverty
In terms of single mother poverty, the demographic groups most similar to Immigrants from Singapore are Indian (Asian) (25.8%, a difference of 0.15%), Immigrants from Ireland (25.8%, a difference of 0.18%), Bolivian (25.9%, a difference of 0.47%), Asian (26.0%, a difference of 0.65%), and Bhutanese (25.6%, a difference of 0.67%).
| Demographics | Rating | Rank | Single Mother Poverty |
| Chinese | 100.0 /100 | #7 | Exceptional 24.6% |
| Immigrants | Iran | 100.0 /100 | #8 | Exceptional 25.1% |
| Immigrants | Lithuania | 100.0 /100 | #9 | Exceptional 25.2% |
| Immigrants | South Central Asia | 100.0 /100 | #10 | Exceptional 25.3% |
| Iranians | 100.0 /100 | #11 | Exceptional 25.5% |
| Bhutanese | 100.0 /100 | #12 | Exceptional 25.6% |
| Indians (Asian) | 100.0 /100 | #13 | Exceptional 25.8% |
| Immigrants | Singapore | 100.0 /100 | #14 | Exceptional 25.8% |
| Immigrants | Ireland | 100.0 /100 | #15 | Exceptional 25.8% |
| Bolivians | 100.0 /100 | #16 | Exceptional 25.9% |
| Asians | 100.0 /100 | #17 | Exceptional 26.0% |
| Immigrants | Pakistan | 100.0 /100 | #18 | Exceptional 26.0% |
| Immigrants | Eastern Asia | 100.0 /100 | #19 | Exceptional 26.1% |
| Immigrants | China | 100.0 /100 | #20 | Exceptional 26.1% |
| Immigrants | Bolivia | 100.0 /100 | #21 | Exceptional 26.2% |