Immigrants from Belize vs Immigrants from Kenya Single Mother Poverty
COMPARE
Immigrants from Belize
Immigrants from Kenya
Single Mother Poverty
Single Mother Poverty Comparison
Immigrants from Belize
Immigrants from Kenya
31.4%
SINGLE MOTHER POVERTY
0.2/ 100
METRIC RATING
267th/ 347
METRIC RANK
28.9%
SINGLE MOTHER POVERTY
65.9/ 100
METRIC RATING
164th/ 347
METRIC RANK
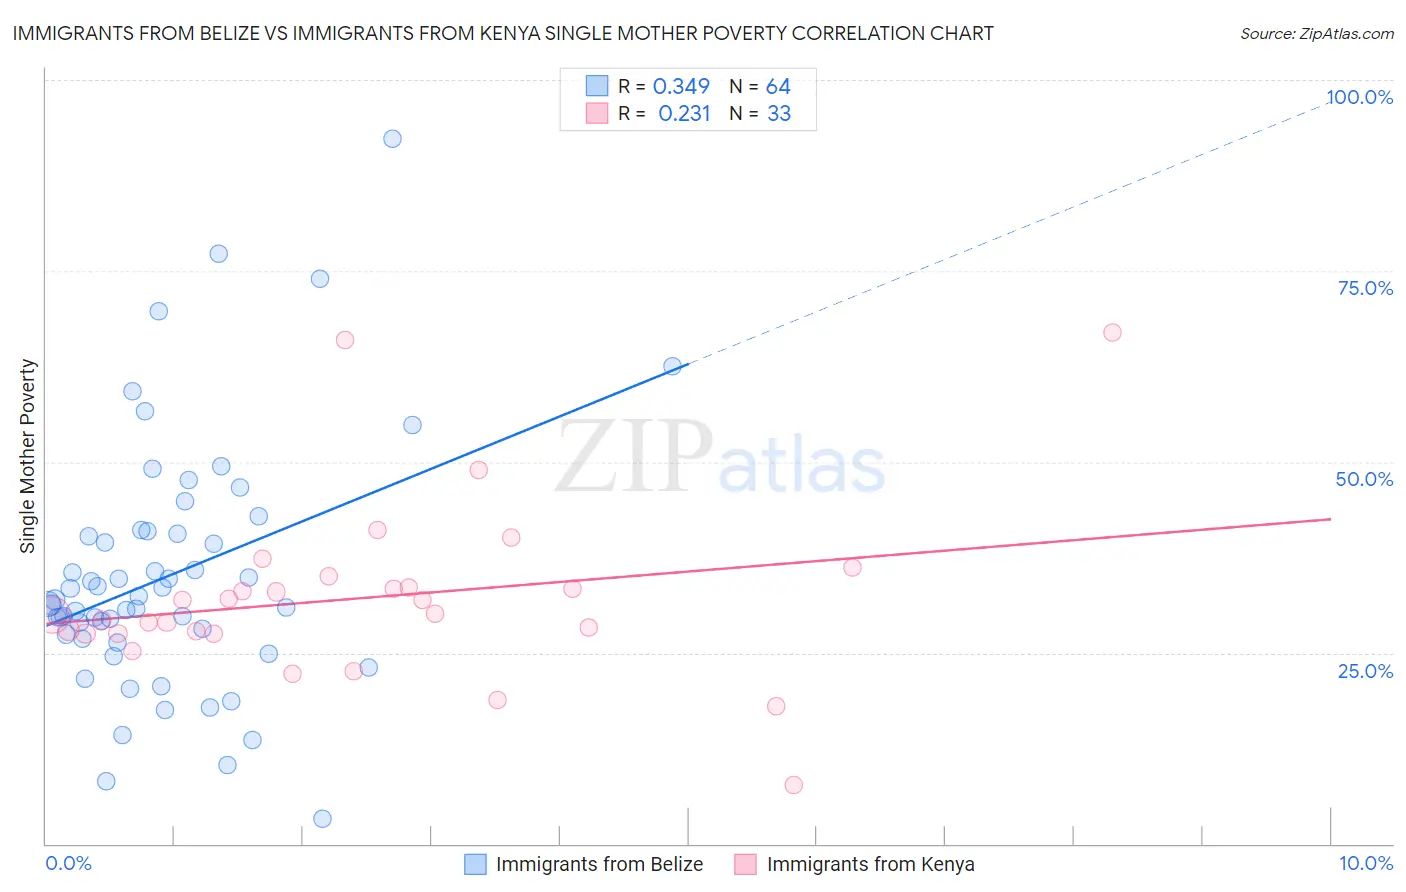
Immigrants from Belize vs Immigrants from Kenya Single Mother Poverty Correlation Chart
The statistical analysis conducted on geographies consisting of 129,542,917 people shows a mild positive correlation between the proportion of Immigrants from Belize and poverty level among single mothers in the United States with a correlation coefficient (R) of 0.349 and weighted average of 31.4%. Similarly, the statistical analysis conducted on geographies consisting of 215,478,455 people shows a weak positive correlation between the proportion of Immigrants from Kenya and poverty level among single mothers in the United States with a correlation coefficient (R) of 0.231 and weighted average of 28.9%, a difference of 8.6%.
Single Mother Poverty Correlation Summary
| Measurement | Immigrants from Belize | Immigrants from Kenya |
| Minimum | 3.2% | 7.7% |
| Maximum | 92.3% | 66.9% |
| Range | 89.1% | 59.2% |
| Mean | 35.1% | 32.2% |
| Median | 31.7% | 30.0% |
| Interquartile 25% (IQ1) | 27.1% | 27.6% |
| Interquartile 75% (IQ3) | 40.7% | 34.3% |
| Interquartile Range (IQR) | 13.5% | 6.8% |
| Standard Deviation (Sample) | 16.3% | 11.5% |
| Standard Deviation (Population) | 16.1% | 11.3% |
Similar Demographics by Single Mother Poverty
Demographics Similar to Immigrants from Belize by Single Mother Poverty
In terms of single mother poverty, the demographic groups most similar to Immigrants from Belize are Subsaharan African (31.4%, a difference of 0.15%), Immigrants from Senegal (31.5%, a difference of 0.18%), German Russian (31.3%, a difference of 0.22%), Scotch-Irish (31.5%, a difference of 0.22%), and Immigrants from Ecuador (31.3%, a difference of 0.25%).
| Demographics | Rating | Rank | Single Mother Poverty |
| Whites/Caucasians | 0.3 /100 | #260 | Tragic 31.2% |
| Immigrants | El Salvador | 0.3 /100 | #261 | Tragic 31.2% |
| Hmong | 0.3 /100 | #262 | Tragic 31.2% |
| Bahamians | 0.2 /100 | #263 | Tragic 31.3% |
| Immigrants | Ecuador | 0.2 /100 | #264 | Tragic 31.3% |
| German Russians | 0.2 /100 | #265 | Tragic 31.3% |
| Sub-Saharan Africans | 0.2 /100 | #266 | Tragic 31.4% |
| Immigrants | Belize | 0.2 /100 | #267 | Tragic 31.4% |
| Immigrants | Senegal | 0.1 /100 | #268 | Tragic 31.5% |
| Scotch-Irish | 0.1 /100 | #269 | Tragic 31.5% |
| British West Indians | 0.1 /100 | #270 | Tragic 31.5% |
| Immigrants | Cabo Verde | 0.1 /100 | #271 | Tragic 31.6% |
| Immigrants | Micronesia | 0.1 /100 | #272 | Tragic 31.6% |
| Fijians | 0.1 /100 | #273 | Tragic 31.6% |
| Bangladeshis | 0.1 /100 | #274 | Tragic 31.7% |
Demographics Similar to Immigrants from Kenya by Single Mother Poverty
In terms of single mother poverty, the demographic groups most similar to Immigrants from Kenya are Immigrants from Nigeria (28.9%, a difference of 0.0%), Scandinavian (28.9%, a difference of 0.020%), Immigrants from Cambodia (28.9%, a difference of 0.040%), Japanese (28.9%, a difference of 0.11%), and Czech (28.9%, a difference of 0.14%).
| Demographics | Rating | Rank | Single Mother Poverty |
| Immigrants | Western Europe | 71.1 /100 | #157 | Good 28.9% |
| Immigrants | Hungary | 70.6 /100 | #158 | Good 28.9% |
| Czechs | 68.4 /100 | #159 | Good 28.9% |
| Japanese | 68.0 /100 | #160 | Good 28.9% |
| Immigrants | Cambodia | 66.6 /100 | #161 | Good 28.9% |
| Scandinavians | 66.2 /100 | #162 | Good 28.9% |
| Immigrants | Nigeria | 65.9 /100 | #163 | Good 28.9% |
| Immigrants | Kenya | 65.9 /100 | #164 | Good 28.9% |
| Arabs | 60.7 /100 | #165 | Good 29.0% |
| Inupiat | 60.4 /100 | #166 | Good 29.0% |
| Costa Ricans | 58.4 /100 | #167 | Average 29.0% |
| Europeans | 57.6 /100 | #168 | Average 29.1% |
| Immigrants | Uruguay | 57.2 /100 | #169 | Average 29.1% |
| New Zealanders | 55.1 /100 | #170 | Average 29.1% |
| Puget Sound Salish | 55.1 /100 | #171 | Average 29.1% |