Luxembourger vs Immigrants from Kenya Single Mother Poverty
COMPARE
Luxembourger
Immigrants from Kenya
Single Mother Poverty
Single Mother Poverty Comparison
Luxembourgers
Immigrants from Kenya
28.5%
SINGLE MOTHER POVERTY
86.4/ 100
METRIC RATING
144th/ 347
METRIC RANK
28.9%
SINGLE MOTHER POVERTY
65.9/ 100
METRIC RATING
164th/ 347
METRIC RANK
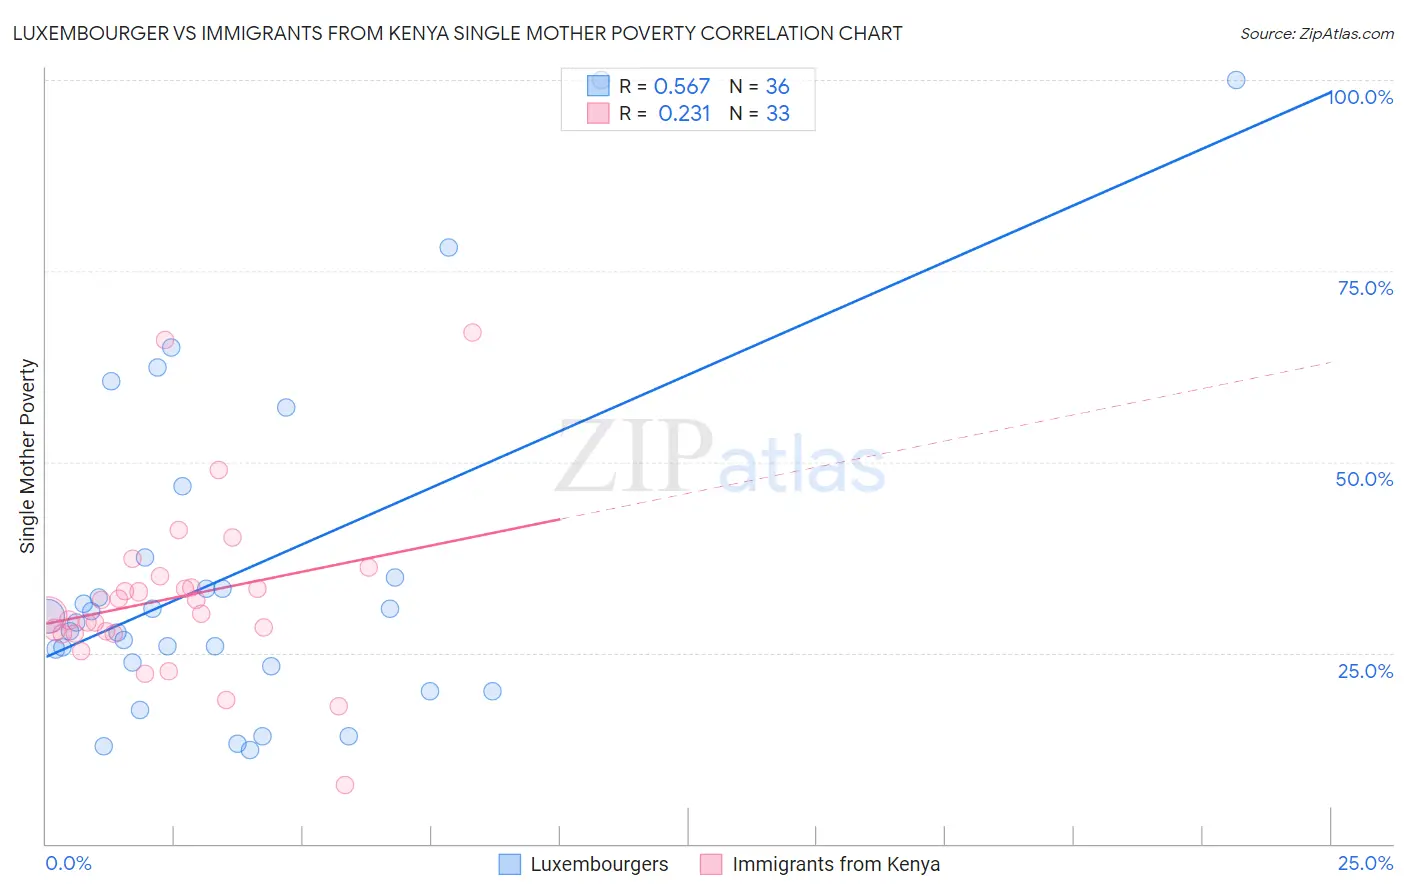
Luxembourger vs Immigrants from Kenya Single Mother Poverty Correlation Chart
The statistical analysis conducted on geographies consisting of 142,536,891 people shows a substantial positive correlation between the proportion of Luxembourgers and poverty level among single mothers in the United States with a correlation coefficient (R) of 0.567 and weighted average of 28.5%. Similarly, the statistical analysis conducted on geographies consisting of 215,478,455 people shows a weak positive correlation between the proportion of Immigrants from Kenya and poverty level among single mothers in the United States with a correlation coefficient (R) of 0.231 and weighted average of 28.9%, a difference of 1.5%.
Single Mother Poverty Correlation Summary
| Measurement | Luxembourger | Immigrants from Kenya |
| Minimum | 12.2% | 7.7% |
| Maximum | 100.0% | 66.9% |
| Range | 87.8% | 59.2% |
| Mean | 35.5% | 32.2% |
| Median | 29.4% | 30.0% |
| Interquartile 25% (IQ1) | 23.5% | 27.6% |
| Interquartile 75% (IQ3) | 36.2% | 34.3% |
| Interquartile Range (IQR) | 12.7% | 6.8% |
| Standard Deviation (Sample) | 22.2% | 11.5% |
| Standard Deviation (Population) | 21.9% | 11.3% |
Demographics Similar to Luxembourgers and Immigrants from Kenya by Single Mother Poverty
In terms of single mother poverty, the demographic groups most similar to Luxembourgers are Immigrants from South America (28.5%, a difference of 0.030%), Immigrants from Denmark (28.5%, a difference of 0.040%), Immigrants from Lebanon (28.6%, a difference of 0.11%), Syrian (28.6%, a difference of 0.12%), and Serbian (28.6%, a difference of 0.14%). Similarly, the demographic groups most similar to Immigrants from Kenya are Immigrants from Nigeria (28.9%, a difference of 0.0%), Scandinavian (28.9%, a difference of 0.020%), Immigrants from Cambodia (28.9%, a difference of 0.040%), Japanese (28.9%, a difference of 0.11%), and Czech (28.9%, a difference of 0.14%).
| Demographics | Rating | Rank | Single Mother Poverty |
| Luxembourgers | 86.4 /100 | #144 | Excellent 28.5% |
| Immigrants | South America | 86.1 /100 | #145 | Excellent 28.5% |
| Immigrants | Denmark | 86.1 /100 | #146 | Excellent 28.5% |
| Immigrants | Lebanon | 85.3 /100 | #147 | Excellent 28.6% |
| Syrians | 85.3 /100 | #148 | Excellent 28.6% |
| Serbians | 85.0 /100 | #149 | Excellent 28.6% |
| Northern Europeans | 81.7 /100 | #150 | Excellent 28.6% |
| Immigrants | Oceania | 79.9 /100 | #151 | Good 28.7% |
| Austrians | 79.0 /100 | #152 | Good 28.7% |
| Slovenes | 76.4 /100 | #153 | Good 28.8% |
| Portuguese | 73.2 /100 | #154 | Good 28.8% |
| Ugandans | 71.7 /100 | #155 | Good 28.8% |
| Iraqis | 71.5 /100 | #156 | Good 28.8% |
| Immigrants | Western Europe | 71.1 /100 | #157 | Good 28.9% |
| Immigrants | Hungary | 70.6 /100 | #158 | Good 28.9% |
| Czechs | 68.4 /100 | #159 | Good 28.9% |
| Japanese | 68.0 /100 | #160 | Good 28.9% |
| Immigrants | Cambodia | 66.6 /100 | #161 | Good 28.9% |
| Scandinavians | 66.2 /100 | #162 | Good 28.9% |
| Immigrants | Nigeria | 65.9 /100 | #163 | Good 28.9% |
| Immigrants | Kenya | 65.9 /100 | #164 | Good 28.9% |