Tsimshian vs Immigrants from Kenya Single Mother Poverty
COMPARE
Tsimshian
Immigrants from Kenya
Single Mother Poverty
Single Mother Poverty Comparison
Tsimshian
Immigrants from Kenya
26.8%
SINGLE MOTHER POVERTY
99.9/ 100
METRIC RATING
43rd/ 347
METRIC RANK
28.9%
SINGLE MOTHER POVERTY
65.9/ 100
METRIC RATING
164th/ 347
METRIC RANK
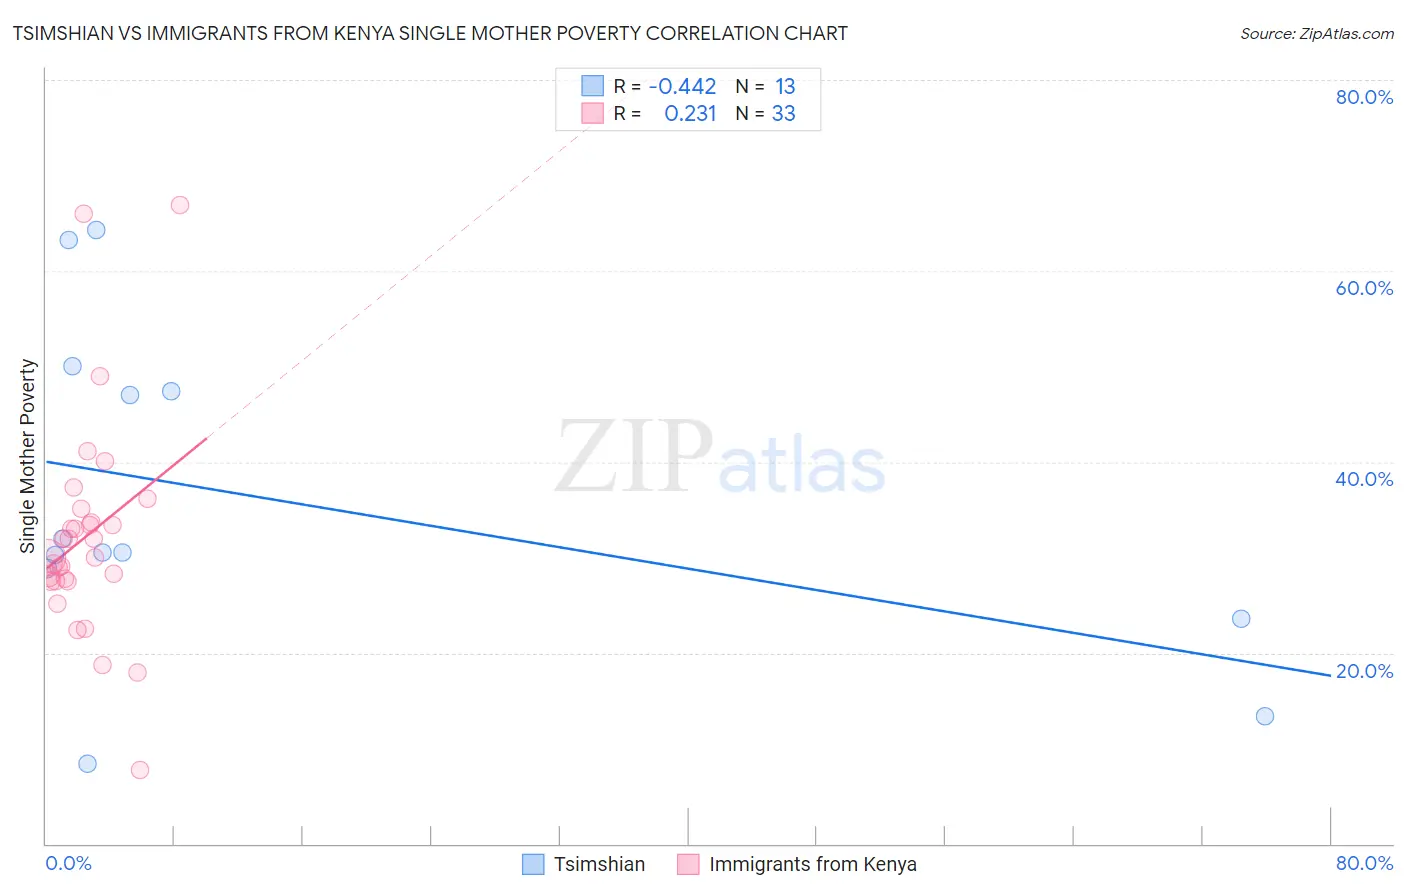
Tsimshian vs Immigrants from Kenya Single Mother Poverty Correlation Chart
The statistical analysis conducted on geographies consisting of 15,606,004 people shows a moderate negative correlation between the proportion of Tsimshian and poverty level among single mothers in the United States with a correlation coefficient (R) of -0.442 and weighted average of 26.8%. Similarly, the statistical analysis conducted on geographies consisting of 215,478,455 people shows a weak positive correlation between the proportion of Immigrants from Kenya and poverty level among single mothers in the United States with a correlation coefficient (R) of 0.231 and weighted average of 28.9%, a difference of 7.9%.
Single Mother Poverty Correlation Summary
| Measurement | Tsimshian | Immigrants from Kenya |
| Minimum | 8.3% | 7.7% |
| Maximum | 64.3% | 66.9% |
| Range | 56.0% | 59.2% |
| Mean | 36.1% | 32.2% |
| Median | 30.6% | 30.0% |
| Interquartile 25% (IQ1) | 26.2% | 27.6% |
| Interquartile 75% (IQ3) | 48.7% | 34.3% |
| Interquartile Range (IQR) | 22.5% | 6.8% |
| Standard Deviation (Sample) | 17.3% | 11.5% |
| Standard Deviation (Population) | 16.6% | 11.3% |
Similar Demographics by Single Mother Poverty
Demographics Similar to Tsimshian by Single Mother Poverty
In terms of single mother poverty, the demographic groups most similar to Tsimshian are Armenian (26.8%, a difference of 0.080%), Immigrants from Sierra Leone (26.9%, a difference of 0.14%), Latvian (26.9%, a difference of 0.21%), Immigrants from Serbia (26.9%, a difference of 0.26%), and Immigrants from Greece (26.7%, a difference of 0.31%).
| Demographics | Rating | Rank | Single Mother Poverty |
| Okinawans | 99.9 /100 | #36 | Exceptional 26.6% |
| Immigrants | Israel | 99.9 /100 | #37 | Exceptional 26.6% |
| Immigrants | Fiji | 99.9 /100 | #38 | Exceptional 26.6% |
| Sri Lankans | 99.9 /100 | #39 | Exceptional 26.7% |
| Immigrants | Vietnam | 99.9 /100 | #40 | Exceptional 26.7% |
| Immigrants | Greece | 99.9 /100 | #41 | Exceptional 26.7% |
| Armenians | 99.9 /100 | #42 | Exceptional 26.8% |
| Tsimshian | 99.9 /100 | #43 | Exceptional 26.8% |
| Immigrants | Sierra Leone | 99.9 /100 | #44 | Exceptional 26.9% |
| Latvians | 99.9 /100 | #45 | Exceptional 26.9% |
| Immigrants | Serbia | 99.9 /100 | #46 | Exceptional 26.9% |
| Egyptians | 99.8 /100 | #47 | Exceptional 26.9% |
| Immigrants | Poland | 99.8 /100 | #48 | Exceptional 26.9% |
| Cambodians | 99.8 /100 | #49 | Exceptional 27.0% |
| Laotians | 99.8 /100 | #50 | Exceptional 27.0% |
Demographics Similar to Immigrants from Kenya by Single Mother Poverty
In terms of single mother poverty, the demographic groups most similar to Immigrants from Kenya are Immigrants from Nigeria (28.9%, a difference of 0.0%), Scandinavian (28.9%, a difference of 0.020%), Immigrants from Cambodia (28.9%, a difference of 0.040%), Japanese (28.9%, a difference of 0.11%), and Czech (28.9%, a difference of 0.14%).
| Demographics | Rating | Rank | Single Mother Poverty |
| Immigrants | Western Europe | 71.1 /100 | #157 | Good 28.9% |
| Immigrants | Hungary | 70.6 /100 | #158 | Good 28.9% |
| Czechs | 68.4 /100 | #159 | Good 28.9% |
| Japanese | 68.0 /100 | #160 | Good 28.9% |
| Immigrants | Cambodia | 66.6 /100 | #161 | Good 28.9% |
| Scandinavians | 66.2 /100 | #162 | Good 28.9% |
| Immigrants | Nigeria | 65.9 /100 | #163 | Good 28.9% |
| Immigrants | Kenya | 65.9 /100 | #164 | Good 28.9% |
| Arabs | 60.7 /100 | #165 | Good 29.0% |
| Inupiat | 60.4 /100 | #166 | Good 29.0% |
| Costa Ricans | 58.4 /100 | #167 | Average 29.0% |
| Europeans | 57.6 /100 | #168 | Average 29.1% |
| Immigrants | Uruguay | 57.2 /100 | #169 | Average 29.1% |
| New Zealanders | 55.1 /100 | #170 | Average 29.1% |
| Puget Sound Salish | 55.1 /100 | #171 | Average 29.1% |