Immigrants from Ethiopia vs Finnish Single Male Poverty
COMPARE
Immigrants from Ethiopia
Finnish
Single Male Poverty
Single Male Poverty Comparison
Immigrants from Ethiopia
Finns
11.4%
SINGLE MALE POVERTY
100.0/ 100
METRIC RATING
34th/ 347
METRIC RANK
13.6%
SINGLE MALE POVERTY
0.9/ 100
METRIC RATING
252nd/ 347
METRIC RANK
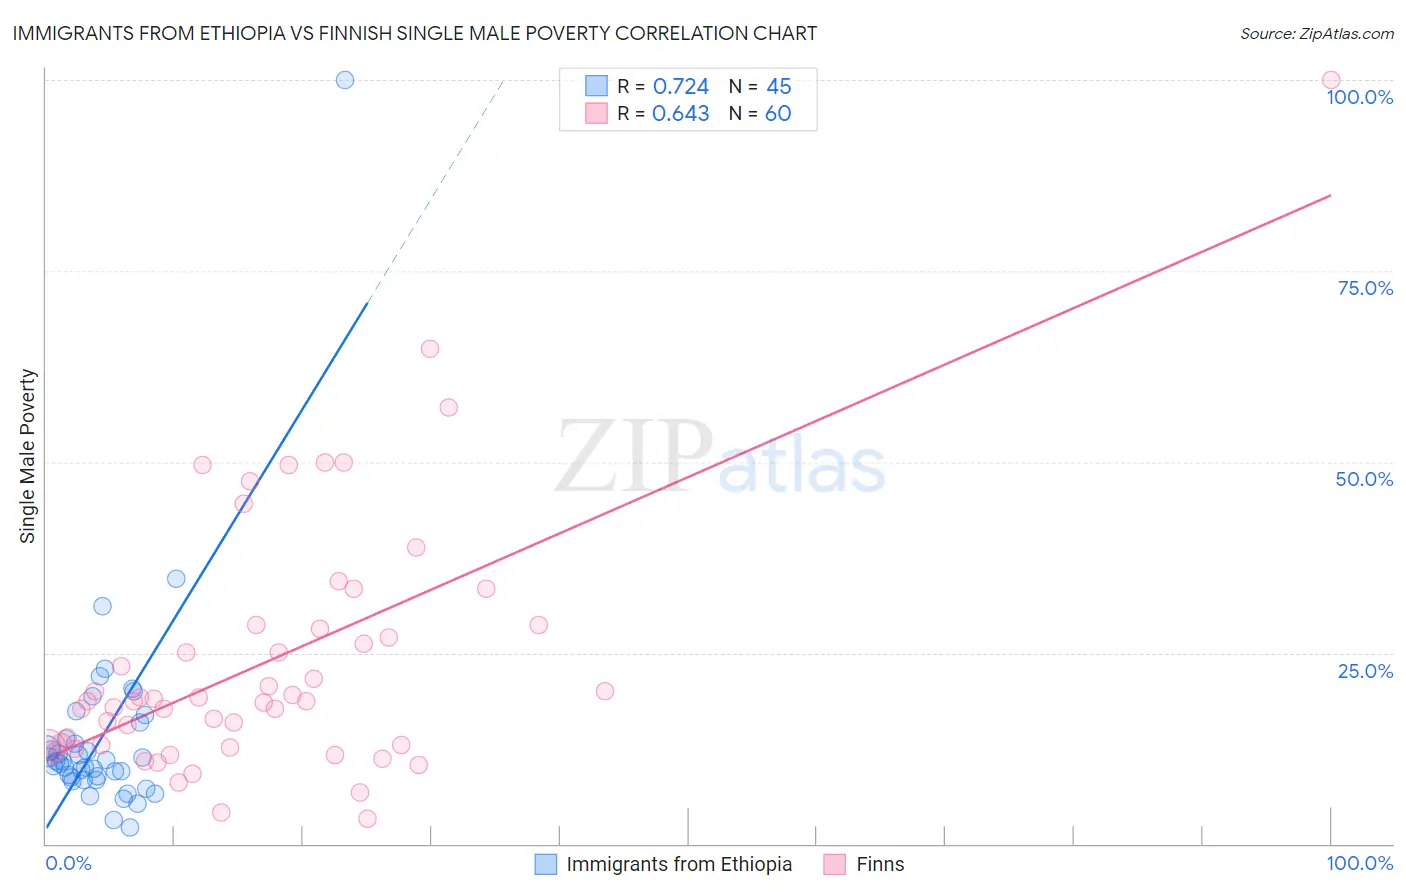
Immigrants from Ethiopia vs Finnish Single Male Poverty Correlation Chart
The statistical analysis conducted on geographies consisting of 197,139,840 people shows a strong positive correlation between the proportion of Immigrants from Ethiopia and poverty level among single males in the United States with a correlation coefficient (R) of 0.724 and weighted average of 11.4%. Similarly, the statistical analysis conducted on geographies consisting of 351,753,879 people shows a significant positive correlation between the proportion of Finns and poverty level among single males in the United States with a correlation coefficient (R) of 0.643 and weighted average of 13.6%, a difference of 18.9%.
Single Male Poverty Correlation Summary
| Measurement | Immigrants from Ethiopia | Finnish |
| Minimum | 2.2% | 3.3% |
| Maximum | 100.0% | 100.0% |
| Range | 97.8% | 96.7% |
| Mean | 14.1% | 23.9% |
| Median | 10.8% | 18.6% |
| Interquartile 25% (IQ1) | 8.5% | 12.8% |
| Interquartile 75% (IQ3) | 14.8% | 28.3% |
| Interquartile Range (IQR) | 6.3% | 15.6% |
| Standard Deviation (Sample) | 14.6% | 17.0% |
| Standard Deviation (Population) | 14.4% | 16.9% |
Similar Demographics by Single Male Poverty
Demographics Similar to Immigrants from Ethiopia by Single Male Poverty
In terms of single male poverty, the demographic groups most similar to Immigrants from Ethiopia are Immigrants from Vietnam (11.4%, a difference of 0.040%), Immigrants from South Eastern Asia (11.4%, a difference of 0.040%), Immigrants from Serbia (11.4%, a difference of 0.070%), Immigrants from Eastern Asia (11.4%, a difference of 0.11%), and Immigrants from Singapore (11.4%, a difference of 0.12%).
| Demographics | Rating | Rank | Single Male Poverty |
| Immigrants | China | 100.0 /100 | #27 | Exceptional 11.4% |
| Immigrants | Asia | 100.0 /100 | #28 | Exceptional 11.4% |
| Immigrants | Egypt | 100.0 /100 | #29 | Exceptional 11.4% |
| Iranians | 100.0 /100 | #30 | Exceptional 11.4% |
| Immigrants | Iran | 100.0 /100 | #31 | Exceptional 11.4% |
| Immigrants | Eastern Asia | 100.0 /100 | #32 | Exceptional 11.4% |
| Immigrants | Vietnam | 100.0 /100 | #33 | Exceptional 11.4% |
| Immigrants | Ethiopia | 100.0 /100 | #34 | Exceptional 11.4% |
| Immigrants | South Eastern Asia | 100.0 /100 | #35 | Exceptional 11.4% |
| Immigrants | Serbia | 100.0 /100 | #36 | Exceptional 11.4% |
| Immigrants | Singapore | 100.0 /100 | #37 | Exceptional 11.4% |
| Sri Lankans | 100.0 /100 | #38 | Exceptional 11.5% |
| Soviet Union | 100.0 /100 | #39 | Exceptional 11.5% |
| Immigrants | Korea | 100.0 /100 | #40 | Exceptional 11.5% |
| Immigrants | Iraq | 99.9 /100 | #41 | Exceptional 11.5% |
Demographics Similar to Finns by Single Male Poverty
In terms of single male poverty, the demographic groups most similar to Finns are Immigrants from Zaire (13.6%, a difference of 0.050%), German Russian (13.6%, a difference of 0.14%), Immigrants from Somalia (13.6%, a difference of 0.15%), Spanish (13.6%, a difference of 0.17%), and Czech (13.5%, a difference of 0.41%).
| Demographics | Rating | Rank | Single Male Poverty |
| Immigrants | Latin America | 1.3 /100 | #245 | Tragic 13.5% |
| Immigrants | Micronesia | 1.2 /100 | #246 | Tragic 13.5% |
| Belgians | 1.2 /100 | #247 | Tragic 13.5% |
| Czechs | 1.2 /100 | #248 | Tragic 13.5% |
| Spanish | 1.0 /100 | #249 | Tragic 13.6% |
| Immigrants | Somalia | 1.0 /100 | #250 | Tragic 13.6% |
| Immigrants | Zaire | 0.9 /100 | #251 | Tragic 13.6% |
| Finns | 0.9 /100 | #252 | Tragic 13.6% |
| German Russians | 0.8 /100 | #253 | Tragic 13.6% |
| Sub-Saharan Africans | 0.5 /100 | #254 | Tragic 13.7% |
| Spaniards | 0.4 /100 | #255 | Tragic 13.7% |
| Immigrants | Belize | 0.4 /100 | #256 | Tragic 13.7% |
| Immigrants | Central America | 0.3 /100 | #257 | Tragic 13.8% |
| Immigrants | Guatemala | 0.3 /100 | #258 | Tragic 13.8% |
| Guatemalans | 0.3 /100 | #259 | Tragic 13.8% |