Immigrants from Senegal vs Finnish Single Male Poverty
COMPARE
Immigrants from Senegal
Finnish
Single Male Poverty
Single Male Poverty Comparison
Immigrants from Senegal
Finns
13.5%
SINGLE MALE POVERTY
1.7/ 100
METRIC RATING
244th/ 347
METRIC RANK
13.6%
SINGLE MALE POVERTY
0.9/ 100
METRIC RATING
252nd/ 347
METRIC RANK
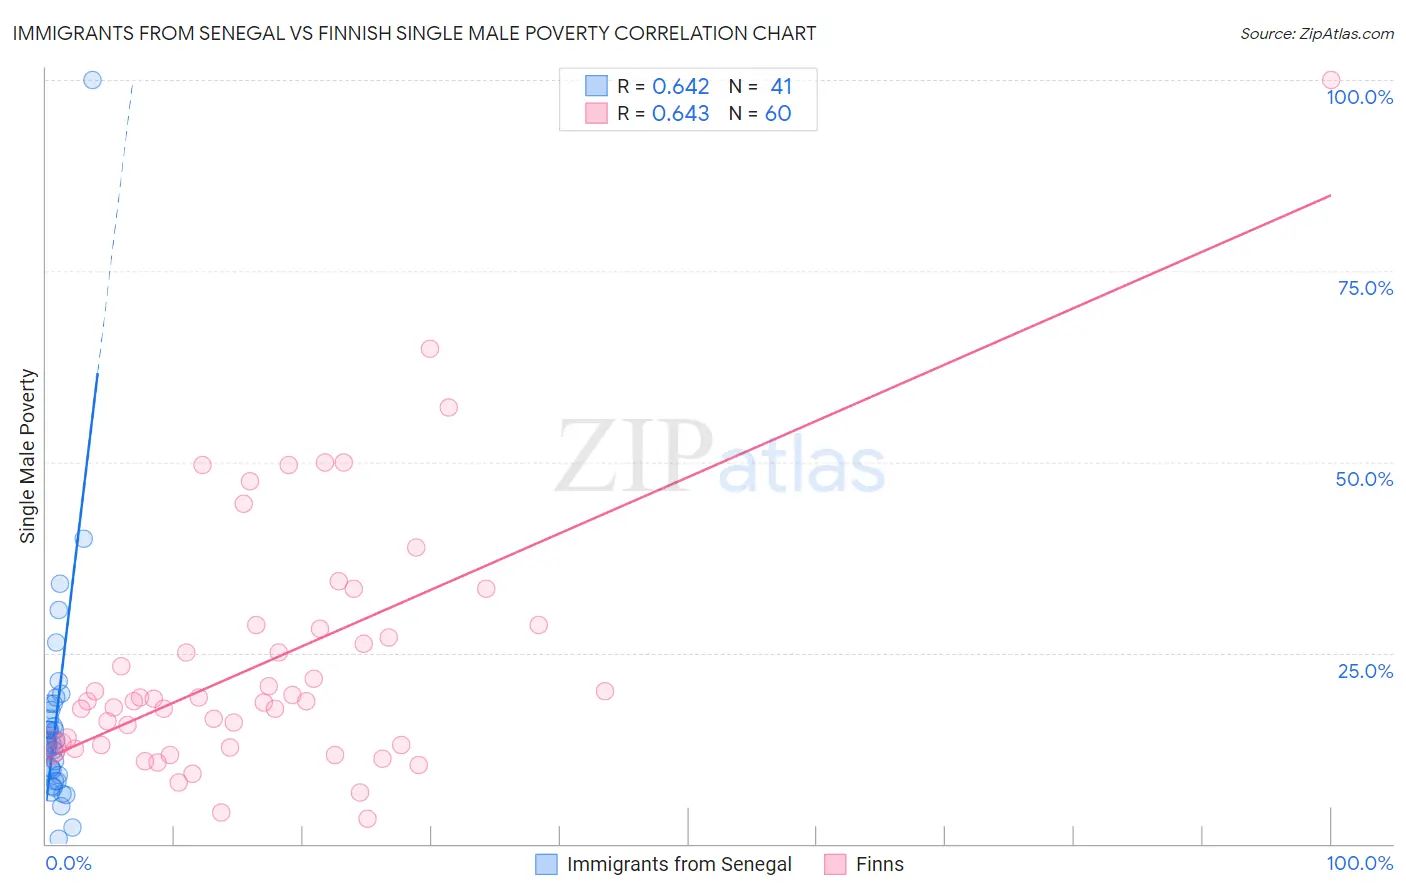
Immigrants from Senegal vs Finnish Single Male Poverty Correlation Chart
The statistical analysis conducted on geographies consisting of 87,233,263 people shows a significant positive correlation between the proportion of Immigrants from Senegal and poverty level among single males in the United States with a correlation coefficient (R) of 0.642 and weighted average of 13.5%. Similarly, the statistical analysis conducted on geographies consisting of 351,753,879 people shows a significant positive correlation between the proportion of Finns and poverty level among single males in the United States with a correlation coefficient (R) of 0.643 and weighted average of 13.6%, a difference of 0.82%.
Single Male Poverty Correlation Summary
| Measurement | Immigrants from Senegal | Finnish |
| Minimum | 0.68% | 3.3% |
| Maximum | 100.0% | 100.0% |
| Range | 99.3% | 96.7% |
| Mean | 16.1% | 23.9% |
| Median | 13.2% | 18.6% |
| Interquartile 25% (IQ1) | 8.6% | 12.8% |
| Interquartile 75% (IQ3) | 17.9% | 28.3% |
| Interquartile Range (IQR) | 9.3% | 15.6% |
| Standard Deviation (Sample) | 15.6% | 17.0% |
| Standard Deviation (Population) | 15.4% | 16.9% |
Demographics Similar to Immigrants from Senegal and Finns by Single Male Poverty
In terms of single male poverty, the demographic groups most similar to Immigrants from Senegal are Immigrants from Latin America (13.5%, a difference of 0.26%), Barbadian (13.4%, a difference of 0.28%), Carpatho Rusyn (13.4%, a difference of 0.32%), Immigrants from Germany (13.4%, a difference of 0.33%), and Immigrants from Micronesia (13.5%, a difference of 0.36%). Similarly, the demographic groups most similar to Finns are Immigrants from Zaire (13.6%, a difference of 0.050%), German Russian (13.6%, a difference of 0.14%), Immigrants from Somalia (13.6%, a difference of 0.15%), Spanish (13.6%, a difference of 0.17%), and Czech (13.5%, a difference of 0.41%).
| Demographics | Rating | Rank | Single Male Poverty |
| Immigrants | Ghana | 3.2 /100 | #238 | Tragic 13.4% |
| Czechoslovakians | 3.0 /100 | #239 | Tragic 13.4% |
| Belizeans | 2.3 /100 | #240 | Tragic 13.4% |
| Immigrants | Germany | 2.1 /100 | #241 | Tragic 13.4% |
| Carpatho Rusyns | 2.1 /100 | #242 | Tragic 13.4% |
| Barbadians | 2.1 /100 | #243 | Tragic 13.4% |
| Immigrants | Senegal | 1.7 /100 | #244 | Tragic 13.5% |
| Immigrants | Latin America | 1.3 /100 | #245 | Tragic 13.5% |
| Immigrants | Micronesia | 1.2 /100 | #246 | Tragic 13.5% |
| Belgians | 1.2 /100 | #247 | Tragic 13.5% |
| Czechs | 1.2 /100 | #248 | Tragic 13.5% |
| Spanish | 1.0 /100 | #249 | Tragic 13.6% |
| Immigrants | Somalia | 1.0 /100 | #250 | Tragic 13.6% |
| Immigrants | Zaire | 0.9 /100 | #251 | Tragic 13.6% |
| Finns | 0.9 /100 | #252 | Tragic 13.6% |
| German Russians | 0.8 /100 | #253 | Tragic 13.6% |
| Sub-Saharan Africans | 0.5 /100 | #254 | Tragic 13.7% |
| Spaniards | 0.4 /100 | #255 | Tragic 13.7% |
| Immigrants | Belize | 0.4 /100 | #256 | Tragic 13.7% |
| Immigrants | Central America | 0.3 /100 | #257 | Tragic 13.8% |
| Immigrants | Guatemala | 0.3 /100 | #258 | Tragic 13.8% |