Costa Rican vs Immigrants from Italy Nursery School
COMPARE
Costa Rican
Immigrants from Italy
Nursery School
Nursery School Comparison
Costa Ricans
Immigrants from Italy
97.8%
NURSERY SCHOOL
11.3/ 100
METRIC RATING
209th/ 347
METRIC RANK
98.0%
NURSERY SCHOOL
59.0/ 100
METRIC RATING
163rd/ 347
METRIC RANK
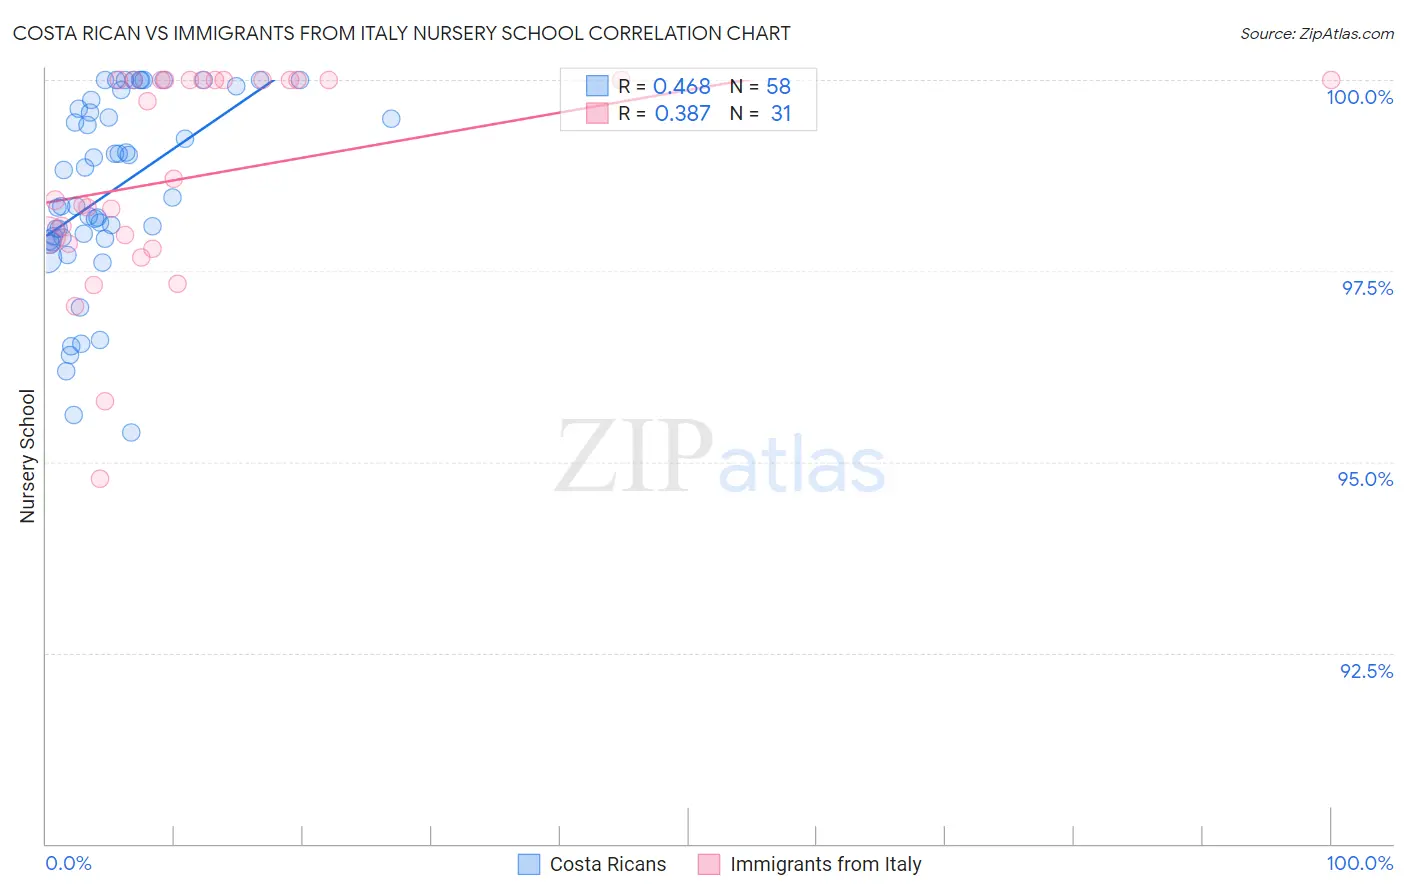
Costa Rican vs Immigrants from Italy Nursery School Correlation Chart
The statistical analysis conducted on geographies consisting of 253,600,765 people shows a moderate positive correlation between the proportion of Costa Ricans and percentage of population with at least nursery school education in the United States with a correlation coefficient (R) of 0.468 and weighted average of 97.8%. Similarly, the statistical analysis conducted on geographies consisting of 324,225,917 people shows a mild positive correlation between the proportion of Immigrants from Italy and percentage of population with at least nursery school education in the United States with a correlation coefficient (R) of 0.387 and weighted average of 98.0%, a difference of 0.18%.
Nursery School Correlation Summary
| Measurement | Costa Rican | Immigrants from Italy |
| Minimum | 95.4% | 94.8% |
| Maximum | 100.0% | 100.0% |
| Range | 4.6% | 5.2% |
| Mean | 98.5% | 98.8% |
| Median | 98.4% | 98.7% |
| Interquartile 25% (IQ1) | 97.9% | 97.9% |
| Interquartile 75% (IQ3) | 99.6% | 100.0% |
| Interquartile Range (IQR) | 1.7% | 2.1% |
| Standard Deviation (Sample) | 1.2% | 1.4% |
| Standard Deviation (Population) | 1.2% | 1.4% |
Similar Demographics by Nursery School
Demographics Similar to Costa Ricans by Nursery School
In terms of nursery school, the demographic groups most similar to Costa Ricans are Immigrants from Northern Africa (97.8%, a difference of 0.0%), Immigrants from Oceania (97.8%, a difference of 0.010%), Laotian (97.8%, a difference of 0.010%), Immigrants from Bahamas (97.8%, a difference of 0.020%), and Immigrants from Albania (97.9%, a difference of 0.030%).
| Demographics | Rating | Rank | Nursery School |
| Immigrants | Ukraine | 19.9 /100 | #202 | Poor 97.9% |
| Immigrants | Uganda | 18.0 /100 | #203 | Poor 97.9% |
| Immigrants | Southern Europe | 17.4 /100 | #204 | Poor 97.9% |
| Immigrants | Chile | 17.3 /100 | #205 | Poor 97.9% |
| Immigrants | Albania | 16.4 /100 | #206 | Poor 97.9% |
| Africans | 15.4 /100 | #207 | Poor 97.9% |
| Immigrants | Northern Africa | 11.7 /100 | #208 | Poor 97.8% |
| Costa Ricans | 11.3 /100 | #209 | Poor 97.8% |
| Immigrants | Oceania | 10.2 /100 | #210 | Poor 97.8% |
| Laotians | 9.8 /100 | #211 | Tragic 97.8% |
| Immigrants | Bahamas | 8.6 /100 | #212 | Tragic 97.8% |
| Moroccans | 8.3 /100 | #213 | Tragic 97.8% |
| South American Indians | 8.0 /100 | #214 | Tragic 97.8% |
| Bahamians | 7.4 /100 | #215 | Tragic 97.8% |
| Uruguayans | 7.1 /100 | #216 | Tragic 97.8% |
Demographics Similar to Immigrants from Italy by Nursery School
In terms of nursery school, the demographic groups most similar to Immigrants from Italy are Immigrants from Russia (98.0%, a difference of 0.0%), Immigrants from Eastern Europe (98.0%, a difference of 0.0%), Brazilian (98.0%, a difference of 0.0%), French American Indian (98.0%, a difference of 0.010%), and Ugandan (98.0%, a difference of 0.010%).
| Demographics | Rating | Rank | Nursery School |
| Venezuelans | 66.6 /100 | #156 | Good 98.0% |
| Comanche | 66.0 /100 | #157 | Good 98.0% |
| Immigrants | North Macedonia | 65.7 /100 | #158 | Good 98.0% |
| French American Indians | 62.1 /100 | #159 | Good 98.0% |
| Immigrants | Russia | 59.9 /100 | #160 | Average 98.0% |
| Immigrants | Eastern Europe | 59.7 /100 | #161 | Average 98.0% |
| Brazilians | 59.4 /100 | #162 | Average 98.0% |
| Immigrants | Italy | 59.0 /100 | #163 | Average 98.0% |
| Ugandans | 56.4 /100 | #164 | Average 98.0% |
| Chileans | 56.4 /100 | #165 | Average 98.0% |
| Spanish Americans | 55.6 /100 | #166 | Average 98.0% |
| Immigrants | Spain | 55.6 /100 | #167 | Average 98.0% |
| Immigrants | Micronesia | 55.0 /100 | #168 | Average 98.0% |
| Immigrants | Korea | 53.8 /100 | #169 | Average 98.0% |
| Bermudans | 53.7 /100 | #170 | Average 98.0% |