Comanche vs Syrian Ambulatory Disability
COMPARE
Comanche
Syrian
Ambulatory Disability
Ambulatory Disability Comparison
Comanche
Syrians
7.5%
AMBULATORY DISABILITY
0.0/ 100
METRIC RATING
325th/ 347
METRIC RANK
6.0%
AMBULATORY DISABILITY
75.5/ 100
METRIC RATING
153rd/ 347
METRIC RANK
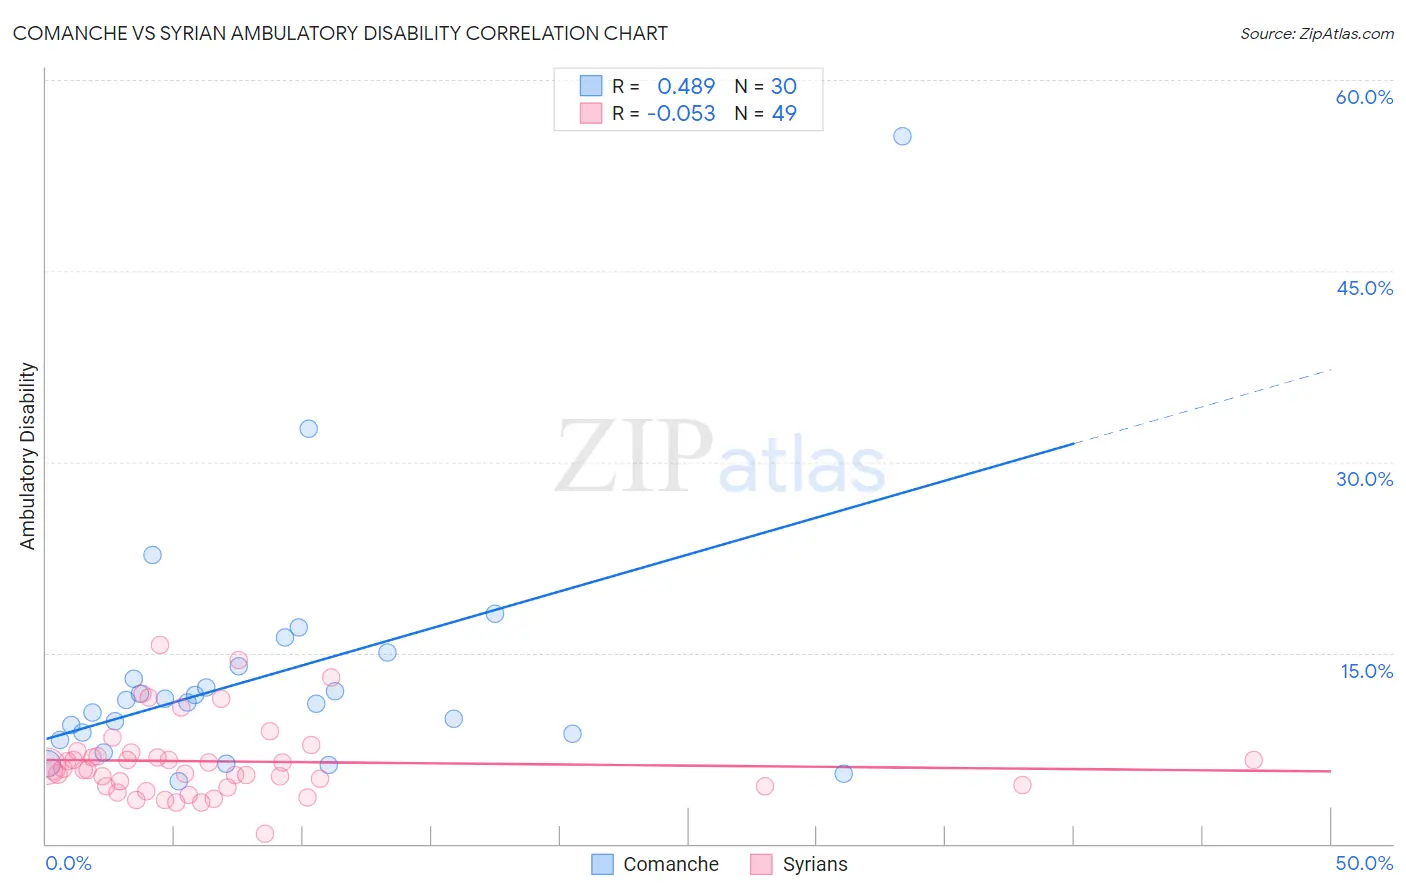
Comanche vs Syrian Ambulatory Disability Correlation Chart
The statistical analysis conducted on geographies consisting of 109,774,668 people shows a moderate positive correlation between the proportion of Comanche and percentage of population with ambulatory disability in the United States with a correlation coefficient (R) of 0.489 and weighted average of 7.5%. Similarly, the statistical analysis conducted on geographies consisting of 266,278,347 people shows a slight negative correlation between the proportion of Syrians and percentage of population with ambulatory disability in the United States with a correlation coefficient (R) of -0.053 and weighted average of 6.0%, a difference of 24.7%.
Ambulatory Disability Correlation Summary
| Measurement | Comanche | Syrian |
| Minimum | 4.9% | 0.77% |
| Maximum | 55.6% | 15.6% |
| Range | 50.6% | 14.8% |
| Mean | 13.3% | 6.5% |
| Median | 11.2% | 5.8% |
| Interquartile 25% (IQ1) | 8.6% | 4.5% |
| Interquartile 75% (IQ3) | 13.9% | 7.0% |
| Interquartile Range (IQR) | 5.3% | 2.5% |
| Standard Deviation (Sample) | 9.7% | 3.0% |
| Standard Deviation (Population) | 9.6% | 3.0% |
Similar Demographics by Ambulatory Disability
Demographics Similar to Comanche by Ambulatory Disability
In terms of ambulatory disability, the demographic groups most similar to Comanche are Navajo (7.5%, a difference of 0.070%), Black/African American (7.5%, a difference of 0.11%), Native/Alaskan (7.5%, a difference of 0.12%), Hopi (7.6%, a difference of 1.1%), and Pueblo (7.6%, a difference of 1.1%).
| Demographics | Rating | Rank | Ambulatory Disability |
| Ottawa | 0.0 /100 | #318 | Tragic 7.2% |
| Dominicans | 0.0 /100 | #319 | Tragic 7.2% |
| Potawatomi | 0.0 /100 | #320 | Tragic 7.3% |
| Apache | 0.0 /100 | #321 | Tragic 7.4% |
| Osage | 0.0 /100 | #322 | Tragic 7.4% |
| Americans | 0.0 /100 | #323 | Tragic 7.4% |
| Navajo | 0.0 /100 | #324 | Tragic 7.5% |
| Comanche | 0.0 /100 | #325 | Tragic 7.5% |
| Blacks/African Americans | 0.0 /100 | #326 | Tragic 7.5% |
| Natives/Alaskans | 0.0 /100 | #327 | Tragic 7.5% |
| Hopi | 0.0 /100 | #328 | Tragic 7.6% |
| Pueblo | 0.0 /100 | #329 | Tragic 7.6% |
| Paiute | 0.0 /100 | #330 | Tragic 7.7% |
| Cajuns | 0.0 /100 | #331 | Tragic 7.8% |
| Menominee | 0.0 /100 | #332 | Tragic 7.8% |
Demographics Similar to Syrians by Ambulatory Disability
In terms of ambulatory disability, the demographic groups most similar to Syrians are Immigrants from Croatia (6.0%, a difference of 0.030%), Immigrants from Scotland (6.0%, a difference of 0.23%), Immigrants from Austria (6.0%, a difference of 0.25%), Northern European (6.0%, a difference of 0.25%), and Ghanaian (6.0%, a difference of 0.29%).
| Demographics | Rating | Rank | Ambulatory Disability |
| Immigrants | Greece | 82.5 /100 | #146 | Excellent 6.0% |
| Immigrants | Moldova | 82.4 /100 | #147 | Excellent 6.0% |
| Immigrants | Eastern Europe | 82.0 /100 | #148 | Excellent 6.0% |
| Lithuanians | 81.9 /100 | #149 | Excellent 6.0% |
| Maltese | 81.6 /100 | #150 | Excellent 6.0% |
| Greeks | 79.6 /100 | #151 | Good 6.0% |
| Immigrants | Austria | 78.8 /100 | #152 | Good 6.0% |
| Syrians | 75.5 /100 | #153 | Good 6.0% |
| Immigrants | Croatia | 75.1 /100 | #154 | Good 6.0% |
| Immigrants | Scotland | 72.1 /100 | #155 | Good 6.0% |
| Northern Europeans | 71.8 /100 | #156 | Good 6.0% |
| Ghanaians | 71.3 /100 | #157 | Good 6.0% |
| Immigrants | Fiji | 71.2 /100 | #158 | Good 6.0% |
| Immigrants | Latvia | 71.1 /100 | #159 | Good 6.0% |
| Central Americans | 69.8 /100 | #160 | Good 6.0% |