Comanche vs Immigrants from Belarus In Labor Force | Age 35-44
COMPARE
Comanche
Immigrants from Belarus
In Labor Force | Age 35-44
In Labor Force | Age 35-44 Comparison
Comanche
Immigrants from Belarus
81.5%
IN LABOR FORCE | AGE 35-44
0.0/ 100
METRIC RATING
316th/ 347
METRIC RANK
84.8%
IN LABOR FORCE | AGE 35-44
95.3/ 100
METRIC RATING
103rd/ 347
METRIC RANK
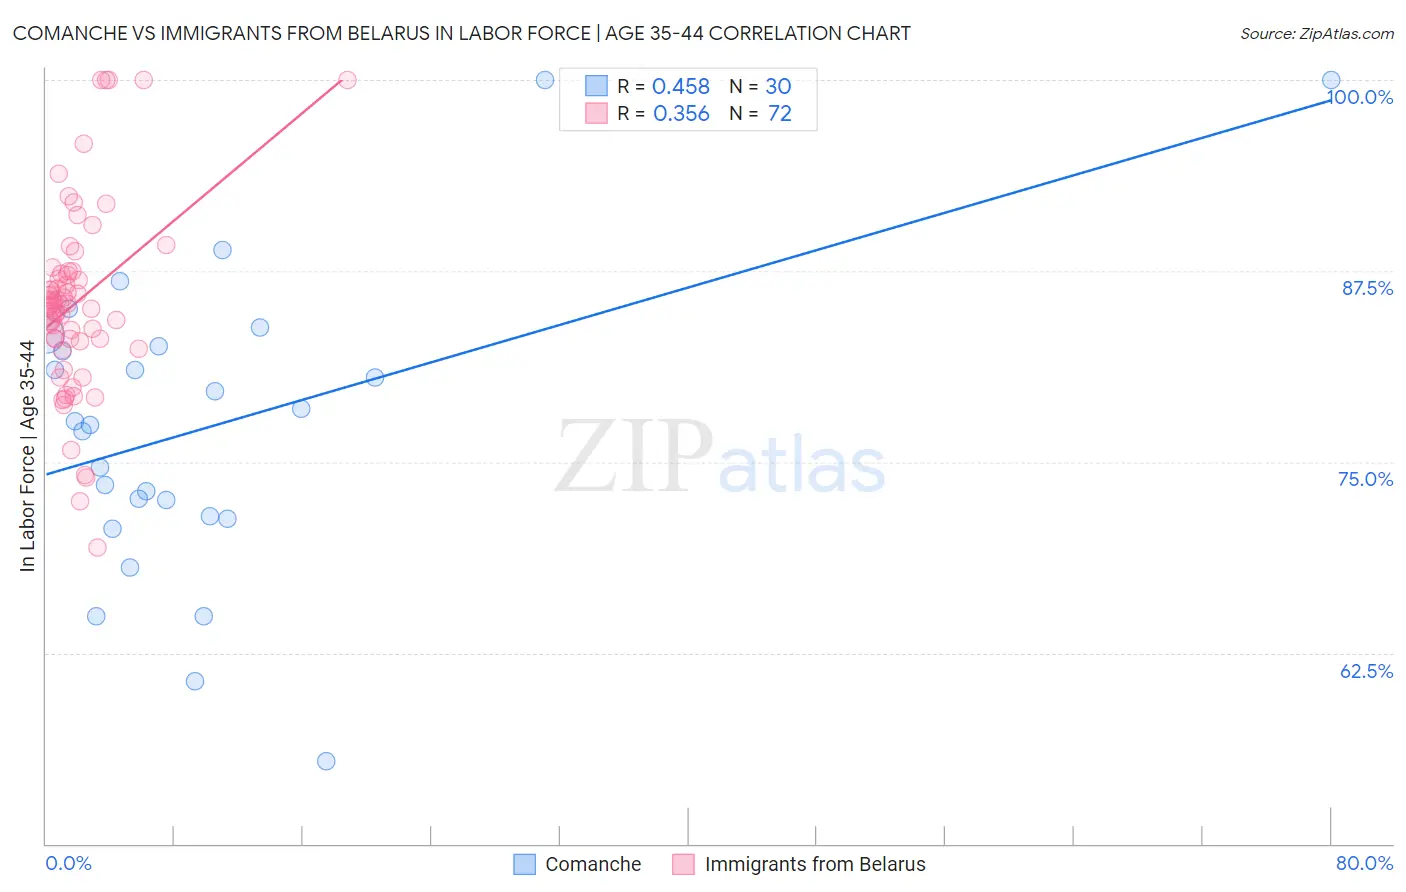
Comanche vs Immigrants from Belarus In Labor Force | Age 35-44 Correlation Chart
The statistical analysis conducted on geographies consisting of 109,773,192 people shows a moderate positive correlation between the proportion of Comanche and labor force participation rate among population between the ages 35 and 44 in the United States with a correlation coefficient (R) of 0.458 and weighted average of 81.5%. Similarly, the statistical analysis conducted on geographies consisting of 150,195,638 people shows a mild positive correlation between the proportion of Immigrants from Belarus and labor force participation rate among population between the ages 35 and 44 in the United States with a correlation coefficient (R) of 0.356 and weighted average of 84.8%, a difference of 4.1%.
In Labor Force | Age 35-44 Correlation Summary
| Measurement | Comanche | Immigrants from Belarus |
| Minimum | 55.4% | 69.4% |
| Maximum | 100.0% | 100.0% |
| Range | 44.6% | 30.6% |
| Mean | 77.3% | 85.5% |
| Median | 77.6% | 85.3% |
| Interquartile 25% (IQ1) | 71.4% | 82.9% |
| Interquartile 75% (IQ3) | 82.6% | 87.4% |
| Interquartile Range (IQR) | 11.2% | 4.5% |
| Standard Deviation (Sample) | 9.9% | 6.1% |
| Standard Deviation (Population) | 9.7% | 6.1% |
Similar Demographics by In Labor Force | Age 35-44
Demographics Similar to Comanche by In Labor Force | Age 35-44
In terms of in labor force | age 35-44, the demographic groups most similar to Comanche are Immigrants from Mexico (81.5%, a difference of 0.020%), Cajun (81.5%, a difference of 0.050%), Cherokee (81.4%, a difference of 0.080%), Alaska Native (81.6%, a difference of 0.16%), and Mexican (81.6%, a difference of 0.16%).
| Demographics | Rating | Rank | In Labor Force | Age 35-44 |
| Cree | 0.0 /100 | #309 | Tragic 82.0% |
| Blackfeet | 0.0 /100 | #310 | Tragic 81.9% |
| Colville | 0.0 /100 | #311 | Tragic 81.7% |
| Alaska Natives | 0.0 /100 | #312 | Tragic 81.6% |
| Mexicans | 0.0 /100 | #313 | Tragic 81.6% |
| Cajuns | 0.0 /100 | #314 | Tragic 81.5% |
| Immigrants | Mexico | 0.0 /100 | #315 | Tragic 81.5% |
| Comanche | 0.0 /100 | #316 | Tragic 81.5% |
| Cherokee | 0.0 /100 | #317 | Tragic 81.4% |
| Alaskan Athabascans | 0.0 /100 | #318 | Tragic 81.3% |
| Inupiat | 0.0 /100 | #319 | Tragic 80.9% |
| Chickasaw | 0.0 /100 | #320 | Tragic 80.9% |
| Puerto Ricans | 0.0 /100 | #321 | Tragic 80.7% |
| Paiute | 0.0 /100 | #322 | Tragic 80.6% |
| Yaqui | 0.0 /100 | #323 | Tragic 80.5% |
Demographics Similar to Immigrants from Belarus by In Labor Force | Age 35-44
In terms of in labor force | age 35-44, the demographic groups most similar to Immigrants from Belarus are Immigrants from Southern Europe (84.8%, a difference of 0.0%), Immigrants from Sweden (84.8%, a difference of 0.0%), Immigrants from Australia (84.8%, a difference of 0.010%), South American (84.8%, a difference of 0.010%), and Immigrants from Bahamas (84.8%, a difference of 0.010%).
| Demographics | Rating | Rank | In Labor Force | Age 35-44 |
| Cubans | 96.6 /100 | #96 | Exceptional 84.8% |
| Egyptians | 96.6 /100 | #97 | Exceptional 84.8% |
| Indians (Asian) | 96.1 /100 | #98 | Exceptional 84.8% |
| Haitians | 96.0 /100 | #99 | Exceptional 84.8% |
| Immigrants | Czechoslovakia | 95.9 /100 | #100 | Exceptional 84.8% |
| Immigrants | Australia | 95.5 /100 | #101 | Exceptional 84.8% |
| Immigrants | Southern Europe | 95.3 /100 | #102 | Exceptional 84.8% |
| Immigrants | Belarus | 95.3 /100 | #103 | Exceptional 84.8% |
| Immigrants | Sweden | 95.2 /100 | #104 | Exceptional 84.8% |
| South Americans | 95.0 /100 | #105 | Exceptional 84.8% |
| Immigrants | Bahamas | 94.8 /100 | #106 | Exceptional 84.8% |
| Immigrants | Romania | 94.7 /100 | #107 | Exceptional 84.8% |
| Immigrants | Argentina | 94.5 /100 | #108 | Exceptional 84.8% |
| Immigrants | Russia | 94.5 /100 | #109 | Exceptional 84.8% |
| Filipinos | 93.8 /100 | #110 | Exceptional 84.7% |