Comanche vs Immigrants from Belarus Family Poverty
COMPARE
Comanche
Immigrants from Belarus
Family Poverty
Family Poverty Comparison
Comanche
Immigrants from Belarus
11.0%
FAMILY POVERTY
0.1/ 100
METRIC RATING
267th/ 347
METRIC RANK
8.5%
FAMILY POVERTY
83.2/ 100
METRIC RATING
146th/ 347
METRIC RANK
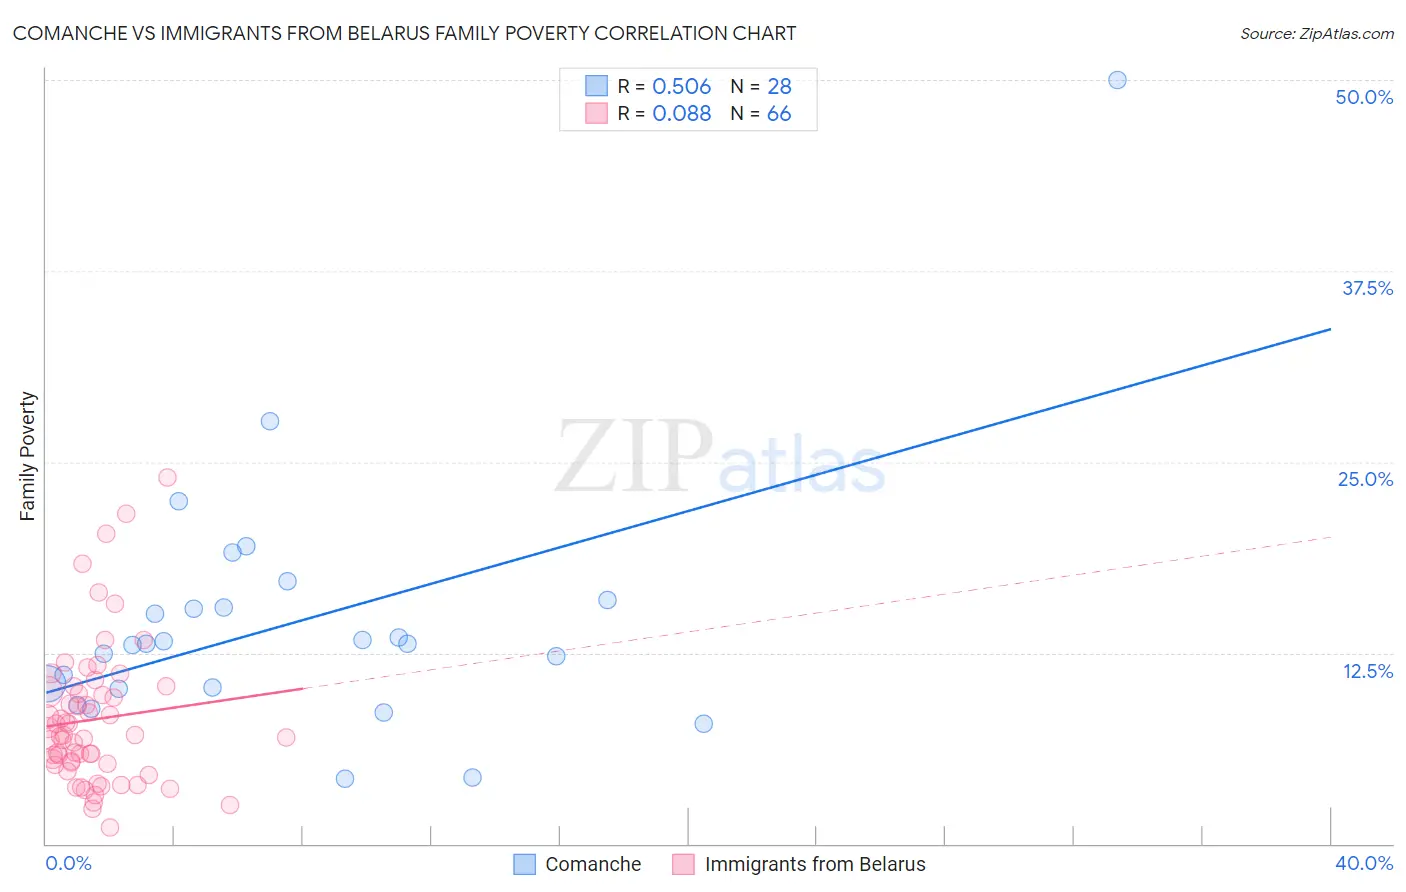
Comanche vs Immigrants from Belarus Family Poverty Correlation Chart
The statistical analysis conducted on geographies consisting of 109,722,823 people shows a substantial positive correlation between the proportion of Comanche and poverty level among families in the United States with a correlation coefficient (R) of 0.506 and weighted average of 11.0%. Similarly, the statistical analysis conducted on geographies consisting of 150,053,959 people shows a slight positive correlation between the proportion of Immigrants from Belarus and poverty level among families in the United States with a correlation coefficient (R) of 0.088 and weighted average of 8.5%, a difference of 29.4%.
Family Poverty Correlation Summary
| Measurement | Comanche | Immigrants from Belarus |
| Minimum | 4.3% | 1.0% |
| Maximum | 50.0% | 24.0% |
| Range | 45.7% | 22.9% |
| Mean | 14.5% | 8.1% |
| Median | 13.1% | 7.1% |
| Interquartile 25% (IQ1) | 10.2% | 5.3% |
| Interquartile 75% (IQ3) | 15.7% | 9.9% |
| Interquartile Range (IQR) | 5.5% | 4.7% |
| Standard Deviation (Sample) | 8.6% | 4.6% |
| Standard Deviation (Population) | 8.4% | 4.6% |
Similar Demographics by Family Poverty
Demographics Similar to Comanche by Family Poverty
In terms of family poverty, the demographic groups most similar to Comanche are Immigrants from El Salvador (11.0%, a difference of 0.010%), Jamaican (11.1%, a difference of 0.10%), Immigrants from Ecuador (11.1%, a difference of 0.58%), Immigrants from Nicaragua (11.1%, a difference of 0.59%), and Immigrants from Bahamas (11.1%, a difference of 0.84%).
| Demographics | Rating | Rank | Family Poverty |
| Bangladeshis | 0.2 /100 | #260 | Tragic 10.9% |
| Shoshone | 0.2 /100 | #261 | Tragic 10.9% |
| Spanish American Indians | 0.2 /100 | #262 | Tragic 10.9% |
| Cape Verdeans | 0.1 /100 | #263 | Tragic 10.9% |
| Trinidadians and Tobagonians | 0.1 /100 | #264 | Tragic 10.9% |
| Immigrants | Trinidad and Tobago | 0.1 /100 | #265 | Tragic 10.9% |
| Immigrants | El Salvador | 0.1 /100 | #266 | Tragic 11.0% |
| Comanche | 0.1 /100 | #267 | Tragic 11.0% |
| Jamaicans | 0.1 /100 | #268 | Tragic 11.1% |
| Immigrants | Ecuador | 0.1 /100 | #269 | Tragic 11.1% |
| Immigrants | Nicaragua | 0.1 /100 | #270 | Tragic 11.1% |
| Immigrants | Bahamas | 0.1 /100 | #271 | Tragic 11.1% |
| Immigrants | Jamaica | 0.1 /100 | #272 | Tragic 11.2% |
| Somalis | 0.1 /100 | #273 | Tragic 11.2% |
| Spanish Americans | 0.1 /100 | #274 | Tragic 11.2% |
Demographics Similar to Immigrants from Belarus by Family Poverty
In terms of family poverty, the demographic groups most similar to Immigrants from Belarus are Immigrants from South Eastern Asia (8.5%, a difference of 0.010%), Albanian (8.5%, a difference of 0.030%), Immigrants from Jordan (8.5%, a difference of 0.030%), Immigrants from Germany (8.5%, a difference of 0.050%), and Yugoslavian (8.5%, a difference of 0.080%).
| Demographics | Rating | Rank | Family Poverty |
| Immigrants | Nepal | 84.2 /100 | #139 | Excellent 8.5% |
| Immigrants | Kazakhstan | 84.1 /100 | #140 | Excellent 8.5% |
| Immigrants | Ukraine | 83.9 /100 | #141 | Excellent 8.5% |
| Yugoslavians | 83.5 /100 | #142 | Excellent 8.5% |
| Immigrants | Germany | 83.3 /100 | #143 | Excellent 8.5% |
| Albanians | 83.3 /100 | #144 | Excellent 8.5% |
| Immigrants | South Eastern Asia | 83.2 /100 | #145 | Excellent 8.5% |
| Immigrants | Belarus | 83.2 /100 | #146 | Excellent 8.5% |
| Immigrants | Jordan | 83.0 /100 | #147 | Excellent 8.5% |
| Scotch-Irish | 82.2 /100 | #148 | Excellent 8.6% |
| Mongolians | 80.4 /100 | #149 | Excellent 8.6% |
| Syrians | 80.3 /100 | #150 | Excellent 8.6% |
| Brazilians | 80.1 /100 | #151 | Excellent 8.6% |
| Samoans | 79.8 /100 | #152 | Good 8.6% |
| Immigrants | Spain | 79.1 /100 | #153 | Good 8.6% |