Comanche vs Immigrants from Cabo Verde Family Poverty
COMPARE
Comanche
Immigrants from Cabo Verde
Family Poverty
Family Poverty Comparison
Comanche
Immigrants from Cabo Verde
11.0%
FAMILY POVERTY
0.1/ 100
METRIC RATING
267th/ 347
METRIC RANK
11.6%
FAMILY POVERTY
0.0/ 100
METRIC RATING
293rd/ 347
METRIC RANK
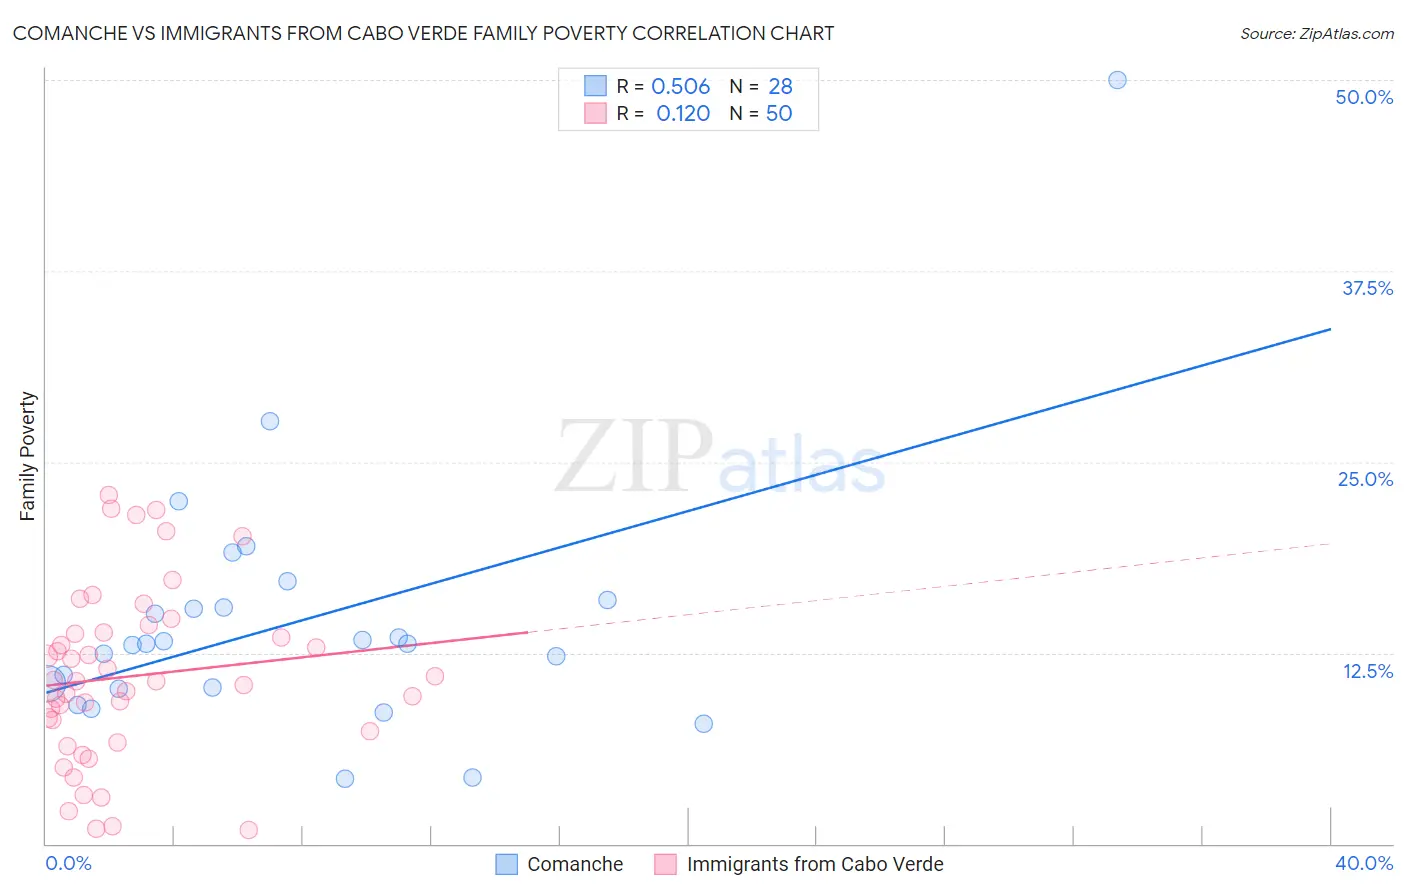
Comanche vs Immigrants from Cabo Verde Family Poverty Correlation Chart
The statistical analysis conducted on geographies consisting of 109,722,823 people shows a substantial positive correlation between the proportion of Comanche and poverty level among families in the United States with a correlation coefficient (R) of 0.506 and weighted average of 11.0%. Similarly, the statistical analysis conducted on geographies consisting of 38,087,138 people shows a poor positive correlation between the proportion of Immigrants from Cabo Verde and poverty level among families in the United States with a correlation coefficient (R) of 0.120 and weighted average of 11.6%, a difference of 4.9%.
Family Poverty Correlation Summary
| Measurement | Comanche | Immigrants from Cabo Verde |
| Minimum | 4.3% | 0.86% |
| Maximum | 50.0% | 22.8% |
| Range | 45.7% | 22.0% |
| Mean | 14.5% | 11.0% |
| Median | 13.1% | 10.6% |
| Interquartile 25% (IQ1) | 10.2% | 7.4% |
| Interquartile 75% (IQ3) | 15.7% | 13.8% |
| Interquartile Range (IQR) | 5.5% | 6.4% |
| Standard Deviation (Sample) | 8.6% | 5.7% |
| Standard Deviation (Population) | 8.4% | 5.6% |
Similar Demographics by Family Poverty
Demographics Similar to Comanche by Family Poverty
In terms of family poverty, the demographic groups most similar to Comanche are Immigrants from El Salvador (11.0%, a difference of 0.010%), Jamaican (11.1%, a difference of 0.10%), Immigrants from Ecuador (11.1%, a difference of 0.58%), Immigrants from Nicaragua (11.1%, a difference of 0.59%), and Immigrants from Bahamas (11.1%, a difference of 0.84%).
| Demographics | Rating | Rank | Family Poverty |
| Bangladeshis | 0.2 /100 | #260 | Tragic 10.9% |
| Shoshone | 0.2 /100 | #261 | Tragic 10.9% |
| Spanish American Indians | 0.2 /100 | #262 | Tragic 10.9% |
| Cape Verdeans | 0.1 /100 | #263 | Tragic 10.9% |
| Trinidadians and Tobagonians | 0.1 /100 | #264 | Tragic 10.9% |
| Immigrants | Trinidad and Tobago | 0.1 /100 | #265 | Tragic 10.9% |
| Immigrants | El Salvador | 0.1 /100 | #266 | Tragic 11.0% |
| Comanche | 0.1 /100 | #267 | Tragic 11.0% |
| Jamaicans | 0.1 /100 | #268 | Tragic 11.1% |
| Immigrants | Ecuador | 0.1 /100 | #269 | Tragic 11.1% |
| Immigrants | Nicaragua | 0.1 /100 | #270 | Tragic 11.1% |
| Immigrants | Bahamas | 0.1 /100 | #271 | Tragic 11.1% |
| Immigrants | Jamaica | 0.1 /100 | #272 | Tragic 11.2% |
| Somalis | 0.1 /100 | #273 | Tragic 11.2% |
| Spanish Americans | 0.1 /100 | #274 | Tragic 11.2% |
Demographics Similar to Immigrants from Cabo Verde by Family Poverty
In terms of family poverty, the demographic groups most similar to Immigrants from Cabo Verde are Immigrants from St. Vincent and the Grenadines (11.6%, a difference of 0.080%), Immigrants from Haiti (11.6%, a difference of 0.20%), Choctaw (11.6%, a difference of 0.25%), Immigrants from Somalia (11.5%, a difference of 0.44%), and Creek (11.7%, a difference of 0.49%).
| Demographics | Rating | Rank | Family Poverty |
| Senegalese | 0.0 /100 | #286 | Tragic 11.5% |
| Vietnamese | 0.0 /100 | #287 | Tragic 11.5% |
| Immigrants | Belize | 0.0 /100 | #288 | Tragic 11.5% |
| Immigrants | Barbados | 0.0 /100 | #289 | Tragic 11.5% |
| West Indians | 0.0 /100 | #290 | Tragic 11.5% |
| Haitians | 0.0 /100 | #291 | Tragic 11.5% |
| Immigrants | Somalia | 0.0 /100 | #292 | Tragic 11.5% |
| Immigrants | Cabo Verde | 0.0 /100 | #293 | Tragic 11.6% |
| Immigrants | St. Vincent and the Grenadines | 0.0 /100 | #294 | Tragic 11.6% |
| Immigrants | Haiti | 0.0 /100 | #295 | Tragic 11.6% |
| Choctaw | 0.0 /100 | #296 | Tragic 11.6% |
| Creek | 0.0 /100 | #297 | Tragic 11.7% |
| Immigrants | Senegal | 0.0 /100 | #298 | Tragic 11.7% |
| Dutch West Indians | 0.0 /100 | #299 | Tragic 11.7% |
| Immigrants | Bangladesh | 0.0 /100 | #300 | Tragic 11.7% |