Comanche vs Immigrants from Cambodia Family Poverty
COMPARE
Comanche
Immigrants from Cambodia
Family Poverty
Family Poverty Comparison
Comanche
Immigrants from Cambodia
11.0%
FAMILY POVERTY
0.1/ 100
METRIC RATING
267th/ 347
METRIC RANK
9.9%
FAMILY POVERTY
4.8/ 100
METRIC RATING
221st/ 347
METRIC RANK
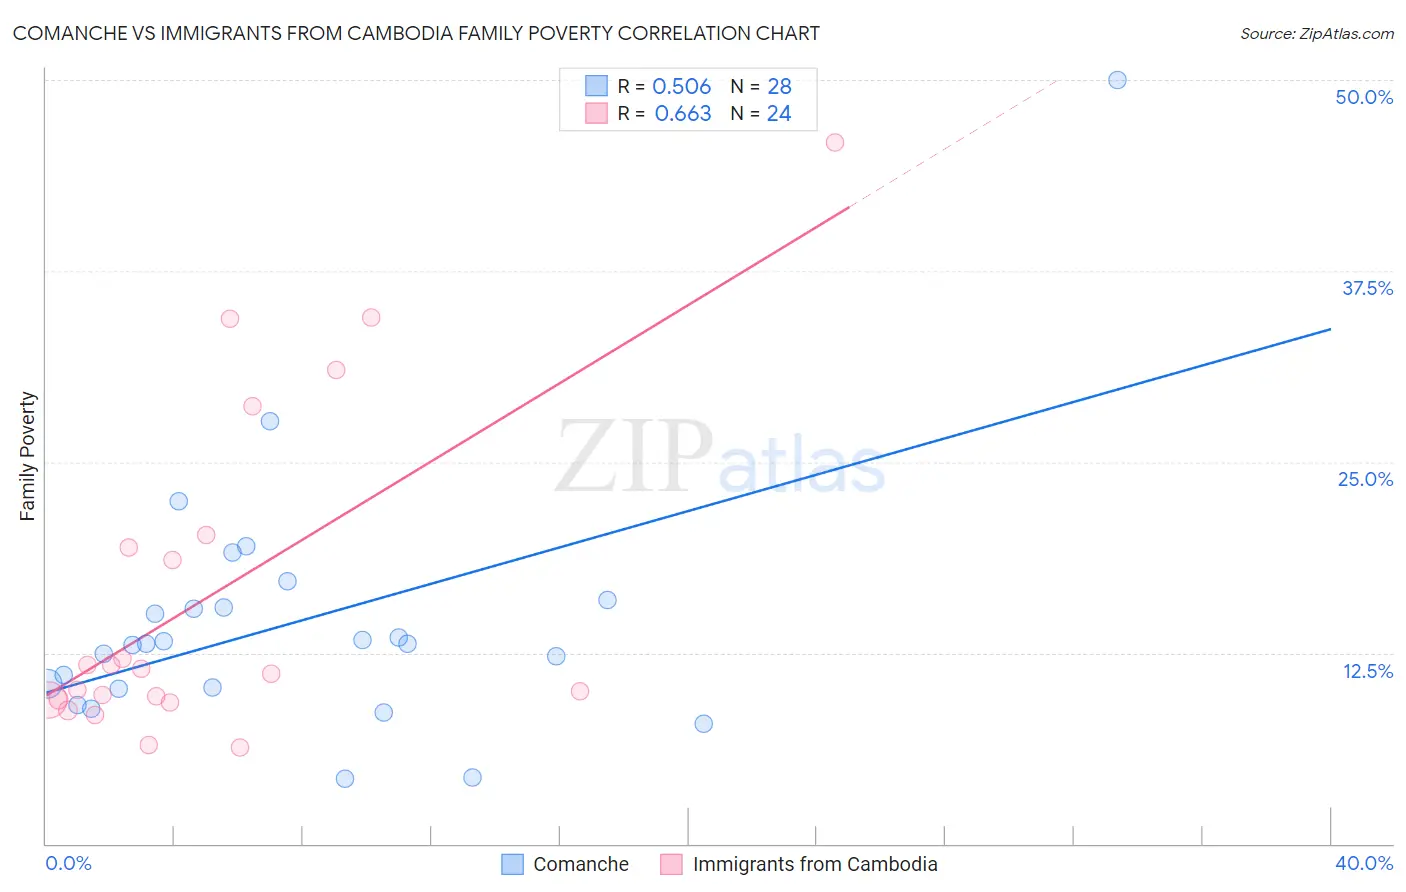
Comanche vs Immigrants from Cambodia Family Poverty Correlation Chart
The statistical analysis conducted on geographies consisting of 109,722,823 people shows a substantial positive correlation between the proportion of Comanche and poverty level among families in the United States with a correlation coefficient (R) of 0.506 and weighted average of 11.0%. Similarly, the statistical analysis conducted on geographies consisting of 204,985,132 people shows a significant positive correlation between the proportion of Immigrants from Cambodia and poverty level among families in the United States with a correlation coefficient (R) of 0.663 and weighted average of 9.9%, a difference of 11.8%.
Family Poverty Correlation Summary
| Measurement | Comanche | Immigrants from Cambodia |
| Minimum | 4.3% | 6.3% |
| Maximum | 50.0% | 45.9% |
| Range | 45.7% | 39.6% |
| Mean | 14.5% | 16.2% |
| Median | 13.1% | 11.3% |
| Interquartile 25% (IQ1) | 10.2% | 9.4% |
| Interquartile 75% (IQ3) | 15.7% | 19.8% |
| Interquartile Range (IQR) | 5.5% | 10.4% |
| Standard Deviation (Sample) | 8.6% | 10.8% |
| Standard Deviation (Population) | 8.4% | 10.5% |
Similar Demographics by Family Poverty
Demographics Similar to Comanche by Family Poverty
In terms of family poverty, the demographic groups most similar to Comanche are Immigrants from El Salvador (11.0%, a difference of 0.010%), Jamaican (11.1%, a difference of 0.10%), Immigrants from Ecuador (11.1%, a difference of 0.58%), Immigrants from Nicaragua (11.1%, a difference of 0.59%), and Immigrants from Bahamas (11.1%, a difference of 0.84%).
| Demographics | Rating | Rank | Family Poverty |
| Bangladeshis | 0.2 /100 | #260 | Tragic 10.9% |
| Shoshone | 0.2 /100 | #261 | Tragic 10.9% |
| Spanish American Indians | 0.2 /100 | #262 | Tragic 10.9% |
| Cape Verdeans | 0.1 /100 | #263 | Tragic 10.9% |
| Trinidadians and Tobagonians | 0.1 /100 | #264 | Tragic 10.9% |
| Immigrants | Trinidad and Tobago | 0.1 /100 | #265 | Tragic 10.9% |
| Immigrants | El Salvador | 0.1 /100 | #266 | Tragic 11.0% |
| Comanche | 0.1 /100 | #267 | Tragic 11.0% |
| Jamaicans | 0.1 /100 | #268 | Tragic 11.1% |
| Immigrants | Ecuador | 0.1 /100 | #269 | Tragic 11.1% |
| Immigrants | Nicaragua | 0.1 /100 | #270 | Tragic 11.1% |
| Immigrants | Bahamas | 0.1 /100 | #271 | Tragic 11.1% |
| Immigrants | Jamaica | 0.1 /100 | #272 | Tragic 11.2% |
| Somalis | 0.1 /100 | #273 | Tragic 11.2% |
| Spanish Americans | 0.1 /100 | #274 | Tragic 11.2% |
Demographics Similar to Immigrants from Cambodia by Family Poverty
In terms of family poverty, the demographic groups most similar to Immigrants from Cambodia are Japanese (9.9%, a difference of 0.030%), Bermudan (9.9%, a difference of 0.27%), Immigrants from Eritrea (9.9%, a difference of 0.33%), Immigrants from Africa (9.9%, a difference of 0.33%), and Panamanian (9.8%, a difference of 0.46%).
| Demographics | Rating | Rank | Family Poverty |
| Immigrants | Micronesia | 6.7 /100 | #214 | Tragic 9.8% |
| Immigrants | Nonimmigrants | 6.7 /100 | #215 | Tragic 9.8% |
| Moroccans | 6.5 /100 | #216 | Tragic 9.8% |
| Americans | 6.2 /100 | #217 | Tragic 9.8% |
| Panamanians | 5.6 /100 | #218 | Tragic 9.8% |
| Immigrants | Eritrea | 5.4 /100 | #219 | Tragic 9.9% |
| Bermudans | 5.3 /100 | #220 | Tragic 9.9% |
| Immigrants | Cambodia | 4.8 /100 | #221 | Tragic 9.9% |
| Japanese | 4.8 /100 | #222 | Tragic 9.9% |
| Immigrants | Africa | 4.3 /100 | #223 | Tragic 9.9% |
| Marshallese | 3.9 /100 | #224 | Tragic 9.9% |
| Immigrants | Immigrants | 3.6 /100 | #225 | Tragic 10.0% |
| Ottawa | 3.3 /100 | #226 | Tragic 10.0% |
| Immigrants | Armenia | 3.3 /100 | #227 | Tragic 10.0% |
| Sudanese | 3.1 /100 | #228 | Tragic 10.0% |