Comanche vs Spanish Family Poverty
COMPARE
Comanche
Spanish
Family Poverty
Family Poverty Comparison
Comanche
Spanish
11.0%
FAMILY POVERTY
0.1/ 100
METRIC RATING
267th/ 347
METRIC RANK
9.3%
FAMILY POVERTY
28.7/ 100
METRIC RATING
192nd/ 347
METRIC RANK
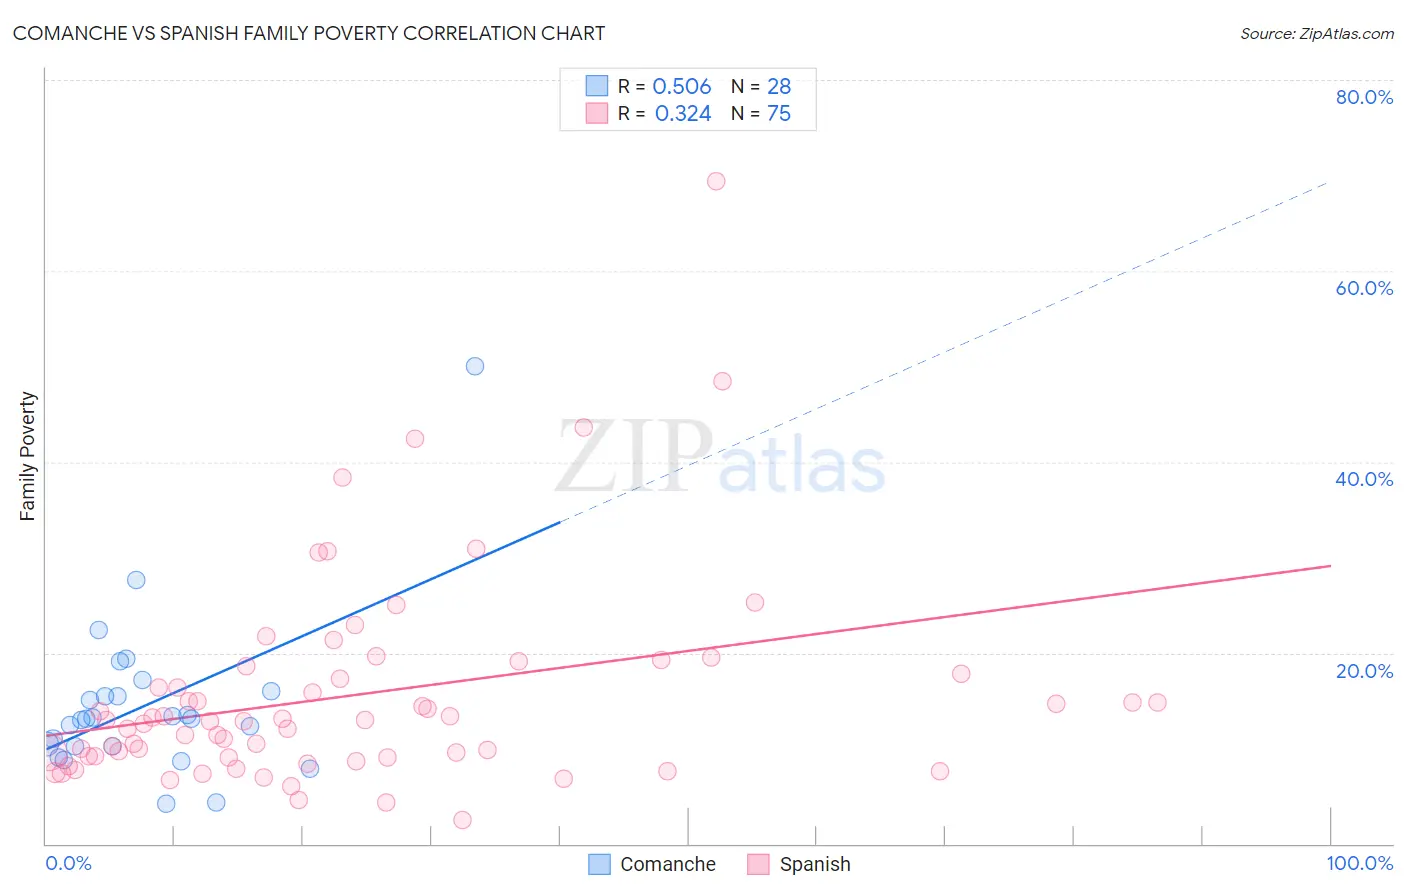
Comanche vs Spanish Family Poverty Correlation Chart
The statistical analysis conducted on geographies consisting of 109,722,823 people shows a substantial positive correlation between the proportion of Comanche and poverty level among families in the United States with a correlation coefficient (R) of 0.506 and weighted average of 11.0%. Similarly, the statistical analysis conducted on geographies consisting of 421,086,812 people shows a mild positive correlation between the proportion of Spanish and poverty level among families in the United States with a correlation coefficient (R) of 0.324 and weighted average of 9.3%, a difference of 19.1%.
Family Poverty Correlation Summary
| Measurement | Comanche | Spanish |
| Minimum | 4.3% | 2.5% |
| Maximum | 50.0% | 69.4% |
| Range | 45.7% | 66.9% |
| Mean | 14.5% | 15.5% |
| Median | 13.1% | 12.8% |
| Interquartile 25% (IQ1) | 10.2% | 9.0% |
| Interquartile 75% (IQ3) | 15.7% | 17.8% |
| Interquartile Range (IQR) | 5.5% | 8.8% |
| Standard Deviation (Sample) | 8.6% | 11.0% |
| Standard Deviation (Population) | 8.4% | 11.0% |
Similar Demographics by Family Poverty
Demographics Similar to Comanche by Family Poverty
In terms of family poverty, the demographic groups most similar to Comanche are Immigrants from El Salvador (11.0%, a difference of 0.010%), Jamaican (11.1%, a difference of 0.10%), Immigrants from Ecuador (11.1%, a difference of 0.58%), Immigrants from Nicaragua (11.1%, a difference of 0.59%), and Immigrants from Bahamas (11.1%, a difference of 0.84%).
| Demographics | Rating | Rank | Family Poverty |
| Bangladeshis | 0.2 /100 | #260 | Tragic 10.9% |
| Shoshone | 0.2 /100 | #261 | Tragic 10.9% |
| Spanish American Indians | 0.2 /100 | #262 | Tragic 10.9% |
| Cape Verdeans | 0.1 /100 | #263 | Tragic 10.9% |
| Trinidadians and Tobagonians | 0.1 /100 | #264 | Tragic 10.9% |
| Immigrants | Trinidad and Tobago | 0.1 /100 | #265 | Tragic 10.9% |
| Immigrants | El Salvador | 0.1 /100 | #266 | Tragic 11.0% |
| Comanche | 0.1 /100 | #267 | Tragic 11.0% |
| Jamaicans | 0.1 /100 | #268 | Tragic 11.1% |
| Immigrants | Ecuador | 0.1 /100 | #269 | Tragic 11.1% |
| Immigrants | Nicaragua | 0.1 /100 | #270 | Tragic 11.1% |
| Immigrants | Bahamas | 0.1 /100 | #271 | Tragic 11.1% |
| Immigrants | Jamaica | 0.1 /100 | #272 | Tragic 11.2% |
| Somalis | 0.1 /100 | #273 | Tragic 11.2% |
| Spanish Americans | 0.1 /100 | #274 | Tragic 11.2% |
Demographics Similar to Spanish by Family Poverty
In terms of family poverty, the demographic groups most similar to Spanish are Ugandan (9.3%, a difference of 0.010%), Immigrants from Western Asia (9.3%, a difference of 0.070%), South American (9.3%, a difference of 0.090%), Venezuelan (9.3%, a difference of 0.21%), and Arab (9.2%, a difference of 0.42%).
| Demographics | Rating | Rank | Family Poverty |
| Immigrants | Saudi Arabia | 38.6 /100 | #185 | Fair 9.1% |
| Colombians | 36.1 /100 | #186 | Fair 9.2% |
| Delaware | 35.4 /100 | #187 | Fair 9.2% |
| Immigrants | Kenya | 34.0 /100 | #188 | Fair 9.2% |
| Immigrants | Afghanistan | 32.1 /100 | #189 | Fair 9.2% |
| Arabs | 31.5 /100 | #190 | Fair 9.2% |
| Ugandans | 28.7 /100 | #191 | Fair 9.3% |
| Spanish | 28.7 /100 | #192 | Fair 9.3% |
| Immigrants | Western Asia | 28.2 /100 | #193 | Fair 9.3% |
| South Americans | 28.1 /100 | #194 | Fair 9.3% |
| Venezuelans | 27.4 /100 | #195 | Fair 9.3% |
| Immigrants | Venezuela | 26.1 /100 | #196 | Fair 9.3% |
| Immigrants | Colombia | 24.4 /100 | #197 | Fair 9.3% |
| Iraqis | 24.2 /100 | #198 | Fair 9.3% |
| Spaniards | 22.8 /100 | #199 | Fair 9.4% |