Comanche vs Sierra Leonean Family Poverty
COMPARE
Comanche
Sierra Leonean
Family Poverty
Family Poverty Comparison
Comanche
Sierra Leoneans
11.0%
FAMILY POVERTY
0.1/ 100
METRIC RATING
267th/ 347
METRIC RANK
9.5%
FAMILY POVERTY
15.6/ 100
METRIC RATING
207th/ 347
METRIC RANK
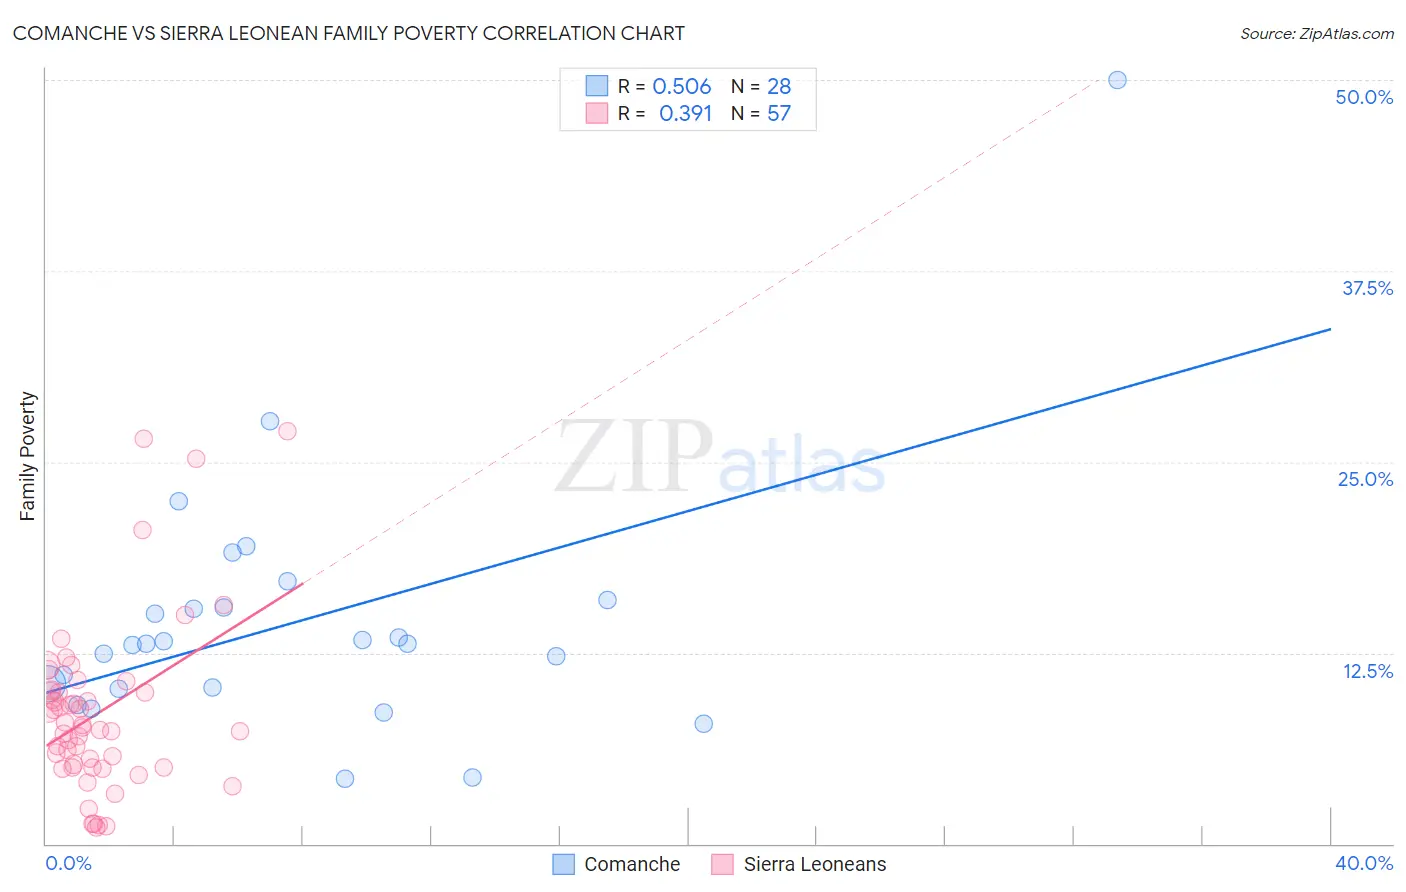
Comanche vs Sierra Leonean Family Poverty Correlation Chart
The statistical analysis conducted on geographies consisting of 109,722,823 people shows a substantial positive correlation between the proportion of Comanche and poverty level among families in the United States with a correlation coefficient (R) of 0.506 and weighted average of 11.0%. Similarly, the statistical analysis conducted on geographies consisting of 83,310,136 people shows a mild positive correlation between the proportion of Sierra Leoneans and poverty level among families in the United States with a correlation coefficient (R) of 0.391 and weighted average of 9.5%, a difference of 16.3%.
Family Poverty Correlation Summary
| Measurement | Comanche | Sierra Leonean |
| Minimum | 4.3% | 1.0% |
| Maximum | 50.0% | 27.0% |
| Range | 45.7% | 26.0% |
| Mean | 14.5% | 8.6% |
| Median | 13.1% | 7.6% |
| Interquartile 25% (IQ1) | 10.2% | 5.0% |
| Interquartile 75% (IQ3) | 15.7% | 10.0% |
| Interquartile Range (IQR) | 5.5% | 5.0% |
| Standard Deviation (Sample) | 8.6% | 5.6% |
| Standard Deviation (Population) | 8.4% | 5.6% |
Similar Demographics by Family Poverty
Demographics Similar to Comanche by Family Poverty
In terms of family poverty, the demographic groups most similar to Comanche are Immigrants from El Salvador (11.0%, a difference of 0.010%), Jamaican (11.1%, a difference of 0.10%), Immigrants from Ecuador (11.1%, a difference of 0.58%), Immigrants from Nicaragua (11.1%, a difference of 0.59%), and Immigrants from Bahamas (11.1%, a difference of 0.84%).
| Demographics | Rating | Rank | Family Poverty |
| Bangladeshis | 0.2 /100 | #260 | Tragic 10.9% |
| Shoshone | 0.2 /100 | #261 | Tragic 10.9% |
| Spanish American Indians | 0.2 /100 | #262 | Tragic 10.9% |
| Cape Verdeans | 0.1 /100 | #263 | Tragic 10.9% |
| Trinidadians and Tobagonians | 0.1 /100 | #264 | Tragic 10.9% |
| Immigrants | Trinidad and Tobago | 0.1 /100 | #265 | Tragic 10.9% |
| Immigrants | El Salvador | 0.1 /100 | #266 | Tragic 11.0% |
| Comanche | 0.1 /100 | #267 | Tragic 11.0% |
| Jamaicans | 0.1 /100 | #268 | Tragic 11.1% |
| Immigrants | Ecuador | 0.1 /100 | #269 | Tragic 11.1% |
| Immigrants | Nicaragua | 0.1 /100 | #270 | Tragic 11.1% |
| Immigrants | Bahamas | 0.1 /100 | #271 | Tragic 11.1% |
| Immigrants | Jamaica | 0.1 /100 | #272 | Tragic 11.2% |
| Somalis | 0.1 /100 | #273 | Tragic 11.2% |
| Spanish Americans | 0.1 /100 | #274 | Tragic 11.2% |
Demographics Similar to Sierra Leoneans by Family Poverty
In terms of family poverty, the demographic groups most similar to Sierra Leoneans are Immigrants from Eastern Africa (9.5%, a difference of 0.11%), Immigrants from Uruguay (9.5%, a difference of 0.40%), Immigrants from South America (9.5%, a difference of 0.53%), Aleut (9.5%, a difference of 0.54%), and Immigrants from Lebanon (9.4%, a difference of 0.73%).
| Demographics | Rating | Rank | Family Poverty |
| Immigrants | Costa Rica | 21.7 /100 | #200 | Fair 9.4% |
| Immigrants | Portugal | 20.5 /100 | #201 | Fair 9.4% |
| Immigrants | Sierra Leone | 19.6 /100 | #202 | Poor 9.4% |
| German Russians | 19.4 /100 | #203 | Poor 9.4% |
| Immigrants | Lebanon | 18.9 /100 | #204 | Poor 9.4% |
| Aleuts | 18.0 /100 | #205 | Poor 9.5% |
| Immigrants | South America | 18.0 /100 | #206 | Poor 9.5% |
| Sierra Leoneans | 15.6 /100 | #207 | Poor 9.5% |
| Immigrants | Eastern Africa | 15.1 /100 | #208 | Poor 9.5% |
| Immigrants | Uruguay | 14.0 /100 | #209 | Poor 9.5% |
| Alsatians | 11.3 /100 | #210 | Poor 9.6% |
| Malaysians | 10.6 /100 | #211 | Poor 9.6% |
| Immigrants | Thailand | 9.7 /100 | #212 | Tragic 9.7% |
| Osage | 8.0 /100 | #213 | Tragic 9.7% |
| Immigrants | Micronesia | 6.7 /100 | #214 | Tragic 9.8% |