Comanche vs Bulgarian In Labor Force | Age 30-34
COMPARE
Comanche
Bulgarian
In Labor Force | Age 30-34
In Labor Force | Age 30-34 Comparison
Comanche
Bulgarians
82.6%
IN LABOR FORCE | AGE 30-34
0.0/ 100
METRIC RATING
297th/ 347
METRIC RANK
86.0%
IN LABOR FORCE | AGE 30-34
100.0/ 100
METRIC RATING
20th/ 347
METRIC RANK
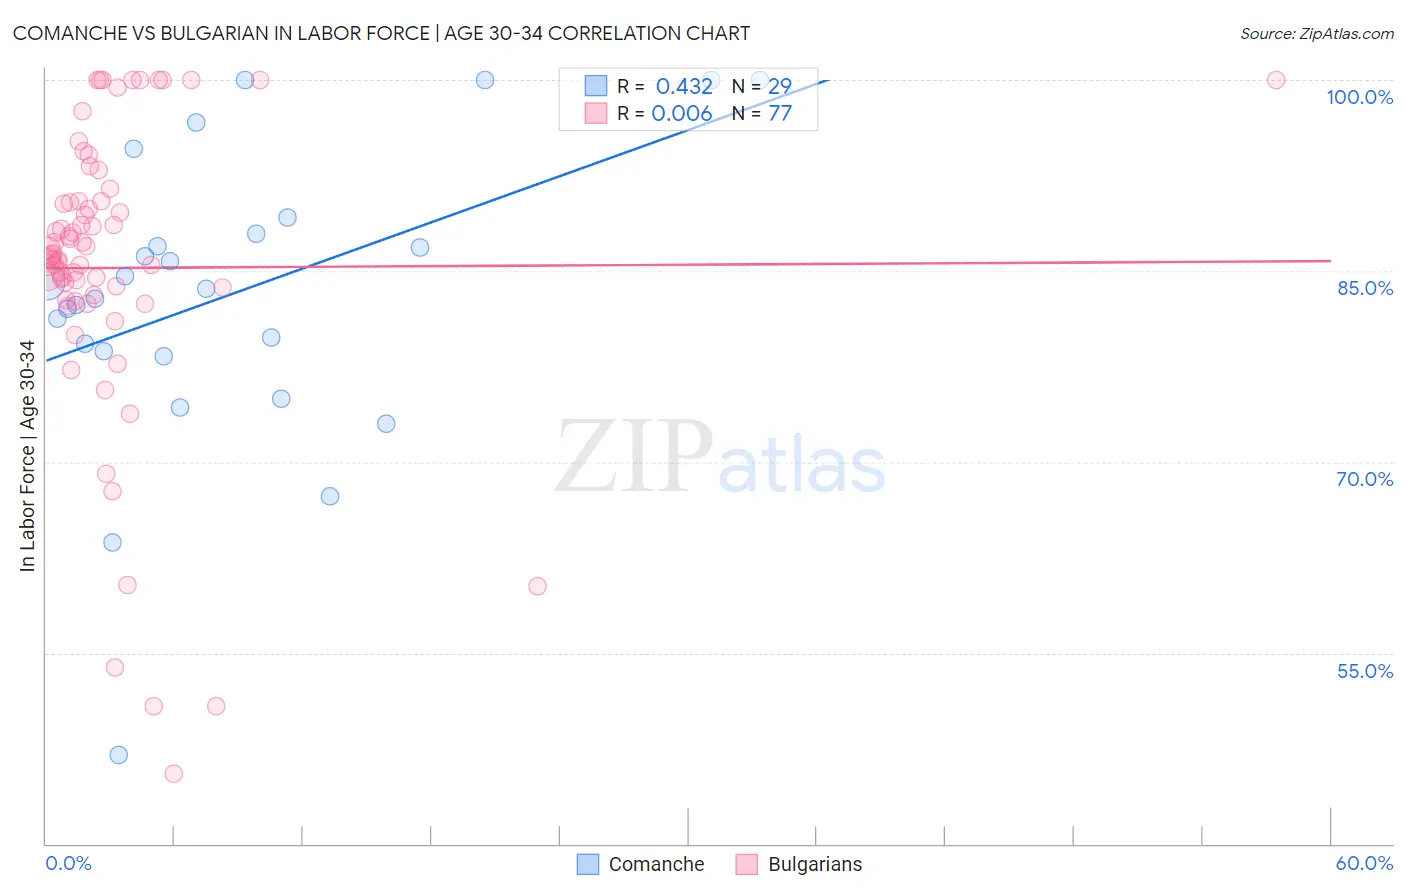
Comanche vs Bulgarian In Labor Force | Age 30-34 Correlation Chart
The statistical analysis conducted on geographies consisting of 109,766,840 people shows a moderate positive correlation between the proportion of Comanche and labor force participation rate among population between the ages 30 and 34 in the United States with a correlation coefficient (R) of 0.432 and weighted average of 82.6%. Similarly, the statistical analysis conducted on geographies consisting of 205,551,369 people shows no correlation between the proportion of Bulgarians and labor force participation rate among population between the ages 30 and 34 in the United States with a correlation coefficient (R) of 0.006 and weighted average of 86.0%, a difference of 4.1%.
In Labor Force | Age 30-34 Correlation Summary
| Measurement | Comanche | Bulgarian |
| Minimum | 46.9% | 45.5% |
| Maximum | 100.0% | 100.0% |
| Range | 53.1% | 54.5% |
| Mean | 83.1% | 85.2% |
| Median | 83.6% | 86.3% |
| Interquartile 25% (IQ1) | 78.5% | 82.9% |
| Interquartile 75% (IQ3) | 88.5% | 90.5% |
| Interquartile Range (IQR) | 10.0% | 7.6% |
| Standard Deviation (Sample) | 11.7% | 11.7% |
| Standard Deviation (Population) | 11.5% | 11.6% |
Similar Demographics by In Labor Force | Age 30-34
Demographics Similar to Comanche by In Labor Force | Age 30-34
In terms of in labor force | age 30-34, the demographic groups most similar to Comanche are Aleut (82.6%, a difference of 0.0%), Chippewa (82.6%, a difference of 0.010%), Pennsylvania German (82.6%, a difference of 0.030%), Immigrants from Central America (82.5%, a difference of 0.13%), and American (82.7%, a difference of 0.15%).
| Demographics | Rating | Rank | In Labor Force | Age 30-34 |
| Blackfeet | 0.0 /100 | #290 | Tragic 82.8% |
| Potawatomi | 0.0 /100 | #291 | Tragic 82.8% |
| Blacks/African Americans | 0.0 /100 | #292 | Tragic 82.8% |
| Nepalese | 0.0 /100 | #293 | Tragic 82.7% |
| Americans | 0.0 /100 | #294 | Tragic 82.7% |
| Pennsylvania Germans | 0.0 /100 | #295 | Tragic 82.6% |
| Chippewa | 0.0 /100 | #296 | Tragic 82.6% |
| Comanche | 0.0 /100 | #297 | Tragic 82.6% |
| Aleuts | 0.0 /100 | #298 | Tragic 82.6% |
| Immigrants | Central America | 0.0 /100 | #299 | Tragic 82.5% |
| Hmong | 0.0 /100 | #300 | Tragic 82.4% |
| Hispanics or Latinos | 0.0 /100 | #301 | Tragic 82.4% |
| Ottawa | 0.0 /100 | #302 | Tragic 82.4% |
| Immigrants | Micronesia | 0.0 /100 | #303 | Tragic 82.4% |
| Tlingit-Haida | 0.0 /100 | #304 | Tragic 82.3% |
Demographics Similar to Bulgarians by In Labor Force | Age 30-34
In terms of in labor force | age 30-34, the demographic groups most similar to Bulgarians are Immigrants from Bulgaria (86.0%, a difference of 0.0%), Sierra Leonean (86.0%, a difference of 0.010%), Bermudan (85.9%, a difference of 0.020%), Estonian (85.9%, a difference of 0.030%), and Immigrants from Eritrea (85.9%, a difference of 0.040%).
| Demographics | Rating | Rank | In Labor Force | Age 30-34 |
| Immigrants | Croatia | 100.0 /100 | #13 | Exceptional 86.1% |
| Immigrants | Cabo Verde | 100.0 /100 | #14 | Exceptional 86.1% |
| Immigrants | Albania | 100.0 /100 | #15 | Exceptional 86.1% |
| Latvians | 100.0 /100 | #16 | Exceptional 86.0% |
| Immigrants | Cameroon | 100.0 /100 | #17 | Exceptional 86.0% |
| Immigrants | Sierra Leone | 100.0 /100 | #18 | Exceptional 86.0% |
| Sierra Leoneans | 100.0 /100 | #19 | Exceptional 86.0% |
| Bulgarians | 100.0 /100 | #20 | Exceptional 86.0% |
| Immigrants | Bulgaria | 100.0 /100 | #21 | Exceptional 86.0% |
| Bermudans | 100.0 /100 | #22 | Exceptional 85.9% |
| Estonians | 100.0 /100 | #23 | Exceptional 85.9% |
| Immigrants | Eritrea | 100.0 /100 | #24 | Exceptional 85.9% |
| Immigrants | North Macedonia | 100.0 /100 | #25 | Exceptional 85.9% |
| Immigrants | Eastern Africa | 100.0 /100 | #26 | Exceptional 85.9% |
| Immigrants | Liberia | 100.0 /100 | #27 | Exceptional 85.9% |