Colville vs South American Single Father Poverty
COMPARE
Colville
South American
Single Father Poverty
Single Father Poverty Comparison
Colville
South Americans
21.4%
SINGLE FATHER POVERTY
0.0/ 100
METRIC RATING
329th/ 347
METRIC RANK
16.0%
SINGLE FATHER POVERTY
85.9/ 100
METRIC RATING
139th/ 347
METRIC RANK
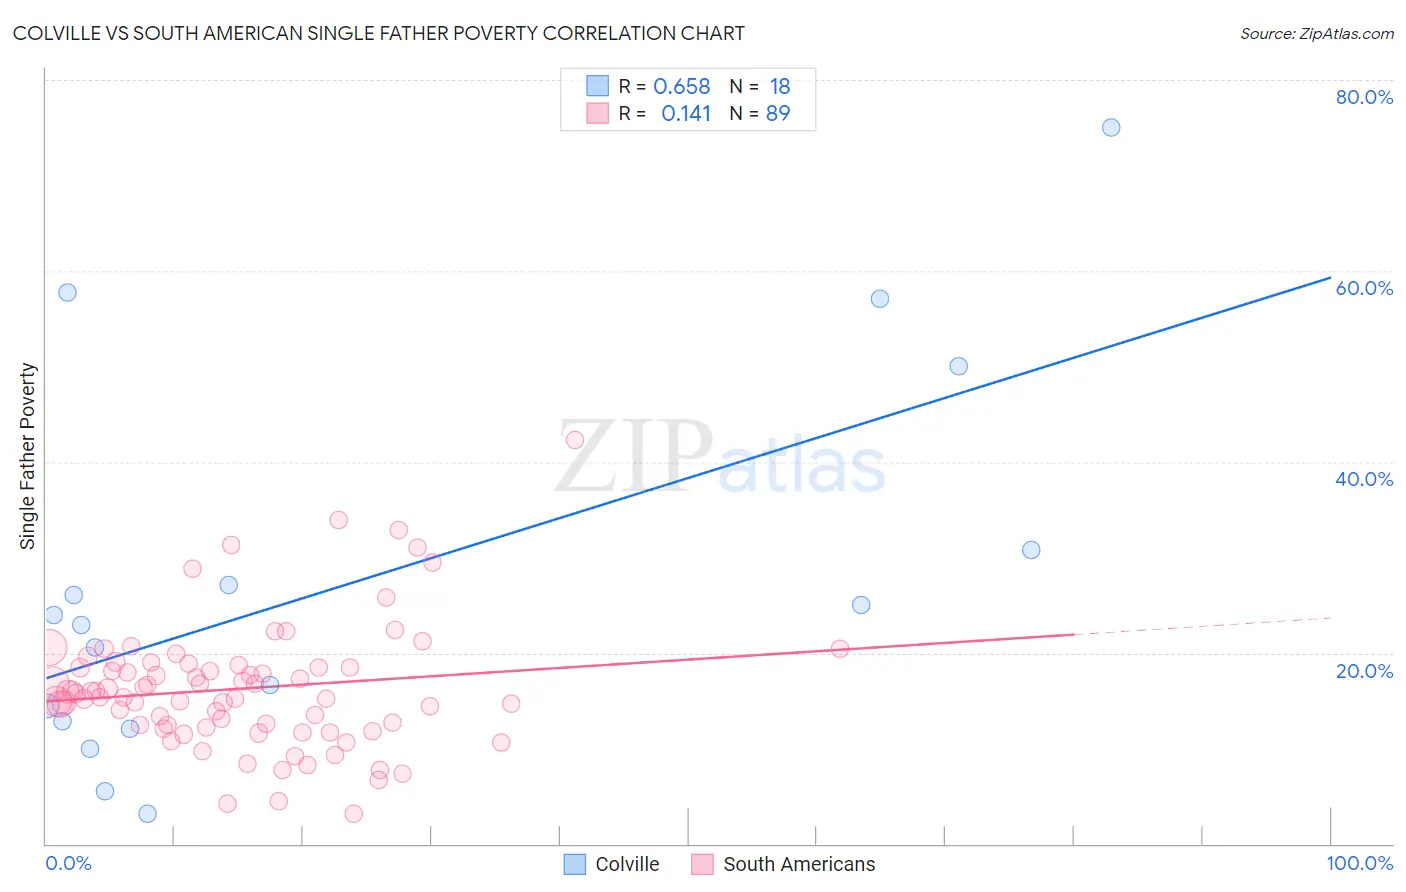
Colville vs South American Single Father Poverty Correlation Chart
The statistical analysis conducted on geographies consisting of 32,657,120 people shows a significant positive correlation between the proportion of Colville and poverty level among single fathers in the United States with a correlation coefficient (R) of 0.658 and weighted average of 21.4%. Similarly, the statistical analysis conducted on geographies consisting of 374,519,857 people shows a poor positive correlation between the proportion of South Americans and poverty level among single fathers in the United States with a correlation coefficient (R) of 0.141 and weighted average of 16.0%, a difference of 33.7%.
Single Father Poverty Correlation Summary
| Measurement | Colville | South American |
| Minimum | 3.1% | 3.2% |
| Maximum | 75.0% | 42.3% |
| Range | 71.9% | 39.1% |
| Mean | 27.3% | 16.2% |
| Median | 23.4% | 15.7% |
| Interquartile 25% (IQ1) | 12.8% | 12.3% |
| Interquartile 75% (IQ3) | 30.8% | 18.6% |
| Interquartile Range (IQR) | 18.0% | 6.3% |
| Standard Deviation (Sample) | 20.0% | 6.6% |
| Standard Deviation (Population) | 19.4% | 6.6% |
Similar Demographics by Single Father Poverty
Demographics Similar to Colville by Single Father Poverty
In terms of single father poverty, the demographic groups most similar to Colville are Pueblo (21.1%, a difference of 1.1%), Paiute (21.6%, a difference of 1.3%), Central American Indian (21.7%, a difference of 1.5%), Choctaw (20.7%, a difference of 3.0%), and Tohono O'odham (22.0%, a difference of 3.1%).
| Demographics | Rating | Rank | Single Father Poverty |
| Creek | 0.0 /100 | #322 | Tragic 19.8% |
| Pennsylvania Germans | 0.0 /100 | #323 | Tragic 20.0% |
| Americans | 0.0 /100 | #324 | Tragic 20.1% |
| Blacks/African Americans | 0.0 /100 | #325 | Tragic 20.4% |
| Immigrants | Yemen | 0.0 /100 | #326 | Tragic 20.6% |
| Choctaw | 0.0 /100 | #327 | Tragic 20.7% |
| Pueblo | 0.0 /100 | #328 | Tragic 21.1% |
| Colville | 0.0 /100 | #329 | Tragic 21.4% |
| Paiute | 0.0 /100 | #330 | Tragic 21.6% |
| Central American Indians | 0.0 /100 | #331 | Tragic 21.7% |
| Tohono O'odham | 0.0 /100 | #332 | Tragic 22.0% |
| Natives/Alaskans | 0.0 /100 | #333 | Tragic 22.4% |
| Kiowa | 0.0 /100 | #334 | Tragic 22.5% |
| Shoshone | 0.0 /100 | #335 | Tragic 22.9% |
| Cajuns | 0.0 /100 | #336 | Tragic 23.1% |
Demographics Similar to South Americans by Single Father Poverty
In terms of single father poverty, the demographic groups most similar to South Americans are Immigrants from Netherlands (16.0%, a difference of 0.050%), Central American (16.0%, a difference of 0.12%), Immigrants from the Azores (15.9%, a difference of 0.13%), Cypriot (15.9%, a difference of 0.16%), and Liberian (16.0%, a difference of 0.22%).
| Demographics | Rating | Rank | Single Father Poverty |
| Immigrants | Portugal | 89.7 /100 | #132 | Excellent 15.9% |
| Immigrants | Syria | 89.5 /100 | #133 | Excellent 15.9% |
| Immigrants | South America | 88.5 /100 | #134 | Excellent 15.9% |
| Immigrants | Sri Lanka | 88.2 /100 | #135 | Excellent 15.9% |
| Cypriots | 87.5 /100 | #136 | Excellent 15.9% |
| Immigrants | Azores | 87.2 /100 | #137 | Excellent 15.9% |
| Central Americans | 87.1 /100 | #138 | Excellent 16.0% |
| South Americans | 85.9 /100 | #139 | Excellent 16.0% |
| Immigrants | Netherlands | 85.3 /100 | #140 | Excellent 16.0% |
| Liberians | 83.3 /100 | #141 | Excellent 16.0% |
| Immigrants | Mexico | 83.3 /100 | #142 | Excellent 16.0% |
| Immigrants | Central America | 83.1 /100 | #143 | Excellent 16.0% |
| Immigrants | Kuwait | 81.4 /100 | #144 | Excellent 16.0% |
| Immigrants | Western Asia | 80.7 /100 | #145 | Excellent 16.0% |
| Immigrants | Hungary | 78.3 /100 | #146 | Good 16.1% |