Colville vs Immigrants from Western Africa Single Father Poverty
COMPARE
Colville
Immigrants from Western Africa
Single Father Poverty
Single Father Poverty Comparison
Colville
Immigrants from Western Africa
21.4%
SINGLE FATHER POVERTY
0.0/ 100
METRIC RATING
329th/ 347
METRIC RANK
16.4%
SINGLE FATHER POVERTY
36.0/ 100
METRIC RATING
181st/ 347
METRIC RANK
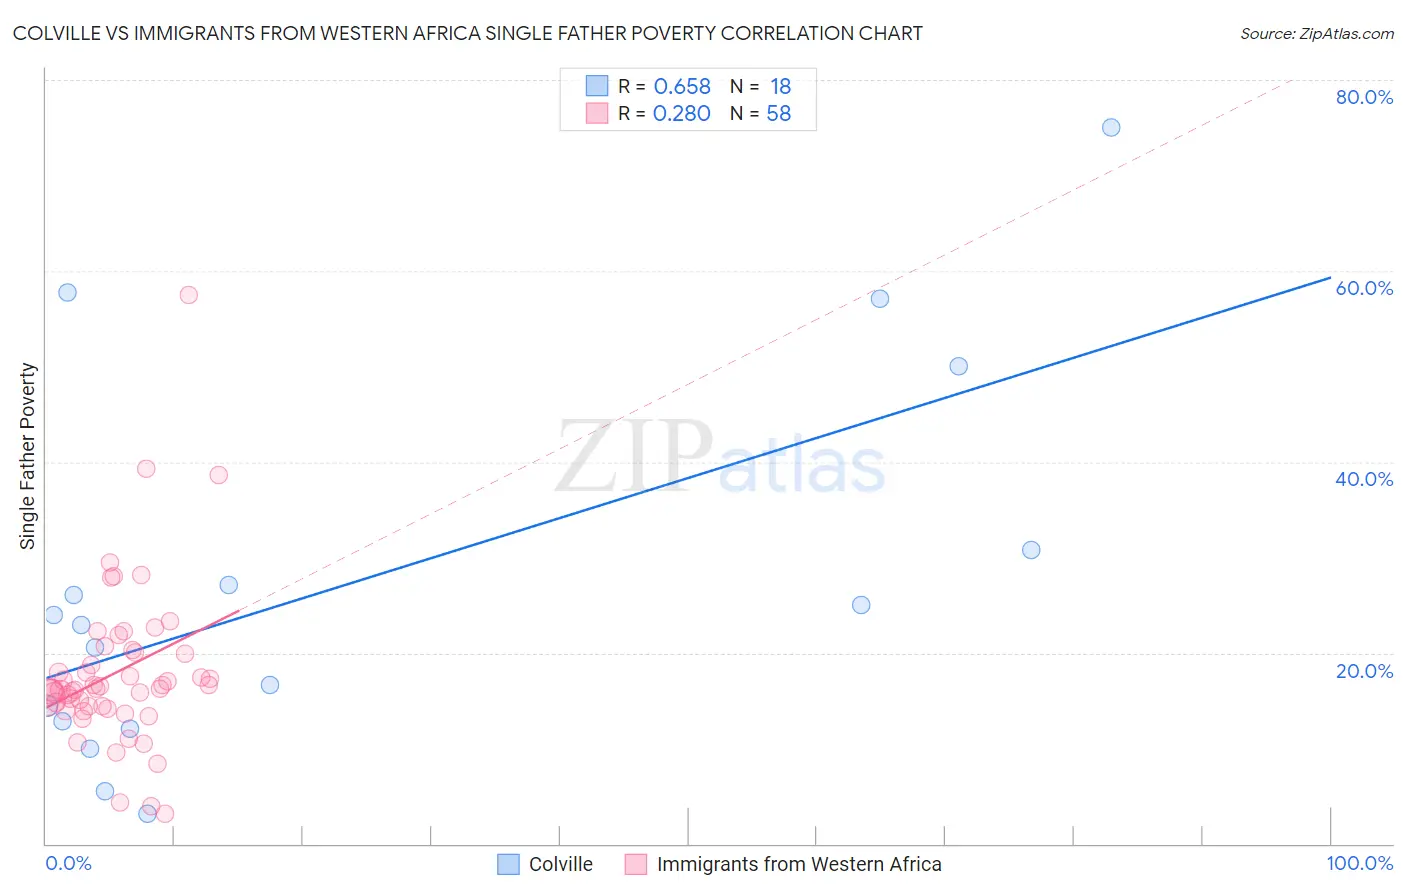
Colville vs Immigrants from Western Africa Single Father Poverty Correlation Chart
The statistical analysis conducted on geographies consisting of 32,657,120 people shows a significant positive correlation between the proportion of Colville and poverty level among single fathers in the United States with a correlation coefficient (R) of 0.658 and weighted average of 21.4%. Similarly, the statistical analysis conducted on geographies consisting of 289,916,705 people shows a weak positive correlation between the proportion of Immigrants from Western Africa and poverty level among single fathers in the United States with a correlation coefficient (R) of 0.280 and weighted average of 16.4%, a difference of 30.2%.
Single Father Poverty Correlation Summary
| Measurement | Colville | Immigrants from Western Africa |
| Minimum | 3.1% | 3.1% |
| Maximum | 75.0% | 57.4% |
| Range | 71.9% | 54.4% |
| Mean | 27.3% | 18.0% |
| Median | 23.4% | 16.2% |
| Interquartile 25% (IQ1) | 12.8% | 14.4% |
| Interquartile 75% (IQ3) | 30.8% | 20.0% |
| Interquartile Range (IQR) | 18.0% | 5.5% |
| Standard Deviation (Sample) | 20.0% | 8.5% |
| Standard Deviation (Population) | 19.4% | 8.5% |
Similar Demographics by Single Father Poverty
Demographics Similar to Colville by Single Father Poverty
In terms of single father poverty, the demographic groups most similar to Colville are Pueblo (21.1%, a difference of 1.1%), Paiute (21.6%, a difference of 1.3%), Central American Indian (21.7%, a difference of 1.5%), Choctaw (20.7%, a difference of 3.0%), and Tohono O'odham (22.0%, a difference of 3.1%).
| Demographics | Rating | Rank | Single Father Poverty |
| Creek | 0.0 /100 | #322 | Tragic 19.8% |
| Pennsylvania Germans | 0.0 /100 | #323 | Tragic 20.0% |
| Americans | 0.0 /100 | #324 | Tragic 20.1% |
| Blacks/African Americans | 0.0 /100 | #325 | Tragic 20.4% |
| Immigrants | Yemen | 0.0 /100 | #326 | Tragic 20.6% |
| Choctaw | 0.0 /100 | #327 | Tragic 20.7% |
| Pueblo | 0.0 /100 | #328 | Tragic 21.1% |
| Colville | 0.0 /100 | #329 | Tragic 21.4% |
| Paiute | 0.0 /100 | #330 | Tragic 21.6% |
| Central American Indians | 0.0 /100 | #331 | Tragic 21.7% |
| Tohono O'odham | 0.0 /100 | #332 | Tragic 22.0% |
| Natives/Alaskans | 0.0 /100 | #333 | Tragic 22.4% |
| Kiowa | 0.0 /100 | #334 | Tragic 22.5% |
| Shoshone | 0.0 /100 | #335 | Tragic 22.9% |
| Cajuns | 0.0 /100 | #336 | Tragic 23.1% |
Demographics Similar to Immigrants from Western Africa by Single Father Poverty
In terms of single father poverty, the demographic groups most similar to Immigrants from Western Africa are Immigrants from Italy (16.4%, a difference of 0.010%), Aleut (16.4%, a difference of 0.030%), Immigrants from Latin America (16.4%, a difference of 0.060%), Cambodian (16.4%, a difference of 0.060%), and Panamanian (16.4%, a difference of 0.12%).
| Demographics | Rating | Rank | Single Father Poverty |
| Swedes | 50.0 /100 | #174 | Average 16.3% |
| Immigrants | Ecuador | 49.7 /100 | #175 | Average 16.3% |
| Vietnamese | 48.0 /100 | #176 | Average 16.3% |
| Immigrants | South Africa | 44.2 /100 | #177 | Average 16.3% |
| Immigrants | Cuba | 41.6 /100 | #178 | Average 16.4% |
| Serbians | 40.9 /100 | #179 | Average 16.4% |
| Immigrants | Latin America | 37.2 /100 | #180 | Fair 16.4% |
| Immigrants | Western Africa | 36.0 /100 | #181 | Fair 16.4% |
| Immigrants | Italy | 35.7 /100 | #182 | Fair 16.4% |
| Aleuts | 35.3 /100 | #183 | Fair 16.4% |
| Cambodians | 34.6 /100 | #184 | Fair 16.4% |
| Panamanians | 33.6 /100 | #185 | Fair 16.4% |
| Immigrants | Venezuela | 31.0 /100 | #186 | Fair 16.4% |
| Ukrainians | 30.4 /100 | #187 | Fair 16.4% |
| Russians | 30.1 /100 | #188 | Fair 16.4% |