Menominee vs Paiute Single Father Poverty
COMPARE
Menominee
Paiute
Single Father Poverty
Single Father Poverty Comparison
Menominee
Paiute
16.8%
SINGLE FATHER POVERTY
6.4/ 100
METRIC RATING
225th/ 347
METRIC RANK
21.6%
SINGLE FATHER POVERTY
0.0/ 100
METRIC RATING
330th/ 347
METRIC RANK
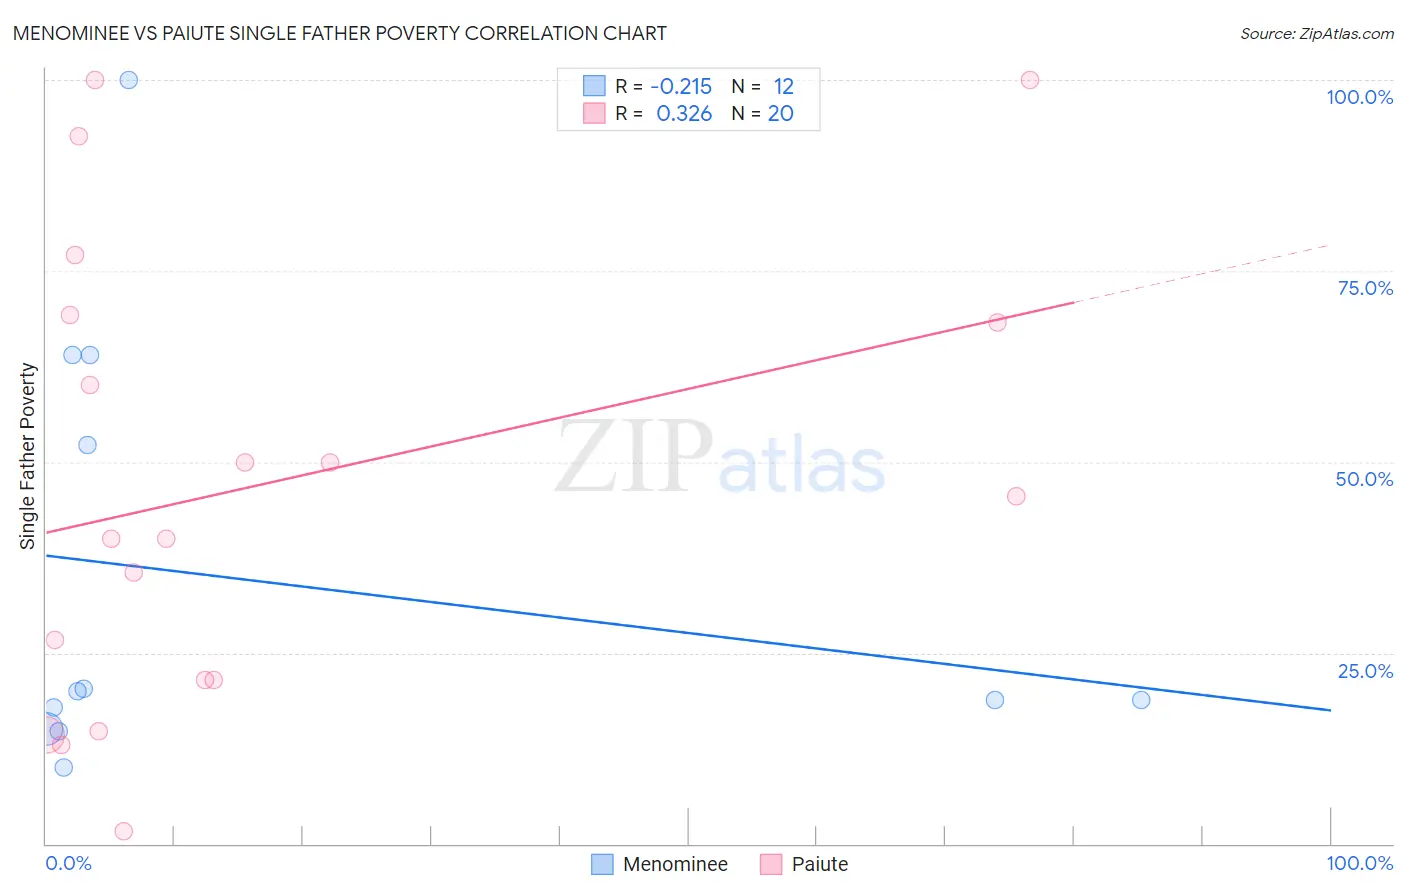
Menominee vs Paiute Single Father Poverty Correlation Chart
The statistical analysis conducted on geographies consisting of 42,801,282 people shows a weak negative correlation between the proportion of Menominee and poverty level among single fathers in the United States with a correlation coefficient (R) of -0.215 and weighted average of 16.8%. Similarly, the statistical analysis conducted on geographies consisting of 54,887,745 people shows a mild positive correlation between the proportion of Paiute and poverty level among single fathers in the United States with a correlation coefficient (R) of 0.326 and weighted average of 21.6%, a difference of 28.9%.
Single Father Poverty Correlation Summary
| Measurement | Menominee | Paiute |
| Minimum | 9.9% | 1.6% |
| Maximum | 100.0% | 100.0% |
| Range | 90.1% | 98.4% |
| Mean | 34.6% | 47.1% |
| Median | 19.4% | 42.7% |
| Interquartile 25% (IQ1) | 16.4% | 21.4% |
| Interquartile 75% (IQ3) | 58.1% | 68.7% |
| Interquartile Range (IQR) | 41.7% | 47.3% |
| Standard Deviation (Sample) | 28.5% | 29.9% |
| Standard Deviation (Population) | 27.2% | 29.2% |
Similar Demographics by Single Father Poverty
Demographics Similar to Menominee by Single Father Poverty
In terms of single father poverty, the demographic groups most similar to Menominee are Immigrants from Norway (16.8%, a difference of 0.020%), Hispanic or Latino (16.8%, a difference of 0.050%), Immigrants from Austria (16.8%, a difference of 0.10%), British (16.8%, a difference of 0.15%), and Belgian (16.8%, a difference of 0.21%).
| Demographics | Rating | Rank | Single Father Poverty |
| Immigrants | Uganda | 8.6 /100 | #218 | Tragic 16.7% |
| Immigrants | Ghana | 8.1 /100 | #219 | Tragic 16.7% |
| Immigrants | Denmark | 8.1 /100 | #220 | Tragic 16.7% |
| Immigrants | Greece | 8.1 /100 | #221 | Tragic 16.7% |
| Immigrants | Spain | 8.0 /100 | #222 | Tragic 16.7% |
| Immigrants | Austria | 7.0 /100 | #223 | Tragic 16.8% |
| Immigrants | Norway | 6.5 /100 | #224 | Tragic 16.8% |
| Menominee | 6.4 /100 | #225 | Tragic 16.8% |
| Hispanics or Latinos | 6.1 /100 | #226 | Tragic 16.8% |
| British | 5.6 /100 | #227 | Tragic 16.8% |
| Belgians | 5.3 /100 | #228 | Tragic 16.8% |
| Israelis | 4.6 /100 | #229 | Tragic 16.8% |
| Immigrants | Trinidad and Tobago | 4.5 /100 | #230 | Tragic 16.8% |
| Spanish Americans | 3.7 /100 | #231 | Tragic 16.9% |
| Immigrants | Grenada | 3.7 /100 | #232 | Tragic 16.9% |
Demographics Similar to Paiute by Single Father Poverty
In terms of single father poverty, the demographic groups most similar to Paiute are Central American Indian (21.7%, a difference of 0.27%), Colville (21.4%, a difference of 1.3%), Tohono O'odham (22.0%, a difference of 1.8%), Pueblo (21.1%, a difference of 2.4%), and Native/Alaskan (22.4%, a difference of 3.5%).
| Demographics | Rating | Rank | Single Father Poverty |
| Pennsylvania Germans | 0.0 /100 | #323 | Tragic 20.0% |
| Americans | 0.0 /100 | #324 | Tragic 20.1% |
| Blacks/African Americans | 0.0 /100 | #325 | Tragic 20.4% |
| Immigrants | Yemen | 0.0 /100 | #326 | Tragic 20.6% |
| Choctaw | 0.0 /100 | #327 | Tragic 20.7% |
| Pueblo | 0.0 /100 | #328 | Tragic 21.1% |
| Colville | 0.0 /100 | #329 | Tragic 21.4% |
| Paiute | 0.0 /100 | #330 | Tragic 21.6% |
| Central American Indians | 0.0 /100 | #331 | Tragic 21.7% |
| Tohono O'odham | 0.0 /100 | #332 | Tragic 22.0% |
| Natives/Alaskans | 0.0 /100 | #333 | Tragic 22.4% |
| Kiowa | 0.0 /100 | #334 | Tragic 22.5% |
| Shoshone | 0.0 /100 | #335 | Tragic 22.9% |
| Cajuns | 0.0 /100 | #336 | Tragic 23.1% |
| Sioux | 0.0 /100 | #337 | Tragic 23.9% |