Guatemalan vs Paiute Single Father Poverty
COMPARE
Guatemalan
Paiute
Single Father Poverty
Single Father Poverty Comparison
Guatemalans
Paiute
16.6%
SINGLE FATHER POVERTY
12.9/ 100
METRIC RATING
210th/ 347
METRIC RANK
21.6%
SINGLE FATHER POVERTY
0.0/ 100
METRIC RATING
330th/ 347
METRIC RANK
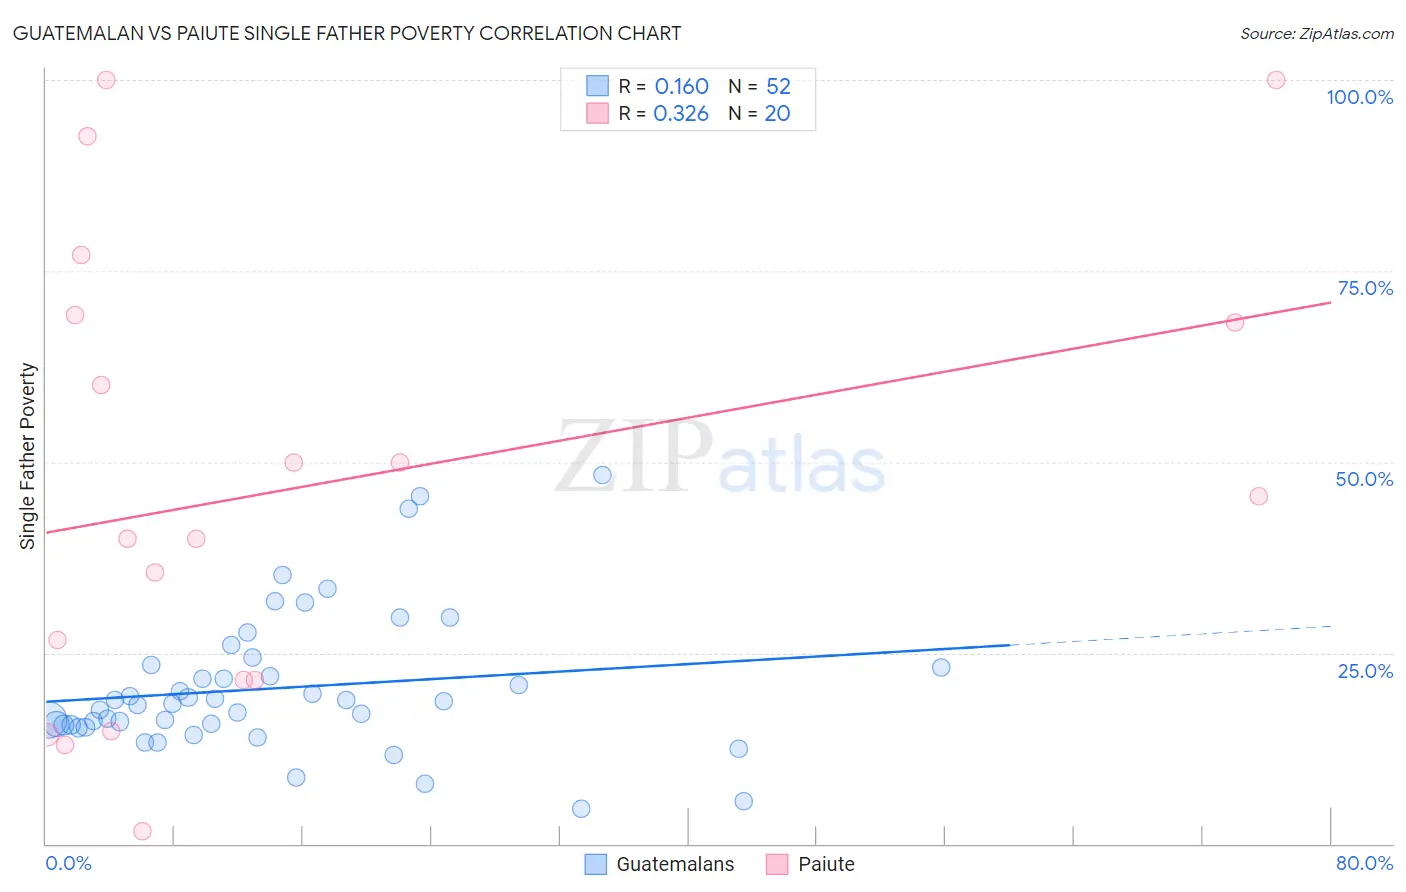
Guatemalan vs Paiute Single Father Poverty Correlation Chart
The statistical analysis conducted on geographies consisting of 326,782,810 people shows a poor positive correlation between the proportion of Guatemalans and poverty level among single fathers in the United States with a correlation coefficient (R) of 0.160 and weighted average of 16.6%. Similarly, the statistical analysis conducted on geographies consisting of 54,887,745 people shows a mild positive correlation between the proportion of Paiute and poverty level among single fathers in the United States with a correlation coefficient (R) of 0.326 and weighted average of 21.6%, a difference of 30.0%.
Single Father Poverty Correlation Summary
| Measurement | Guatemalan | Paiute |
| Minimum | 4.6% | 1.6% |
| Maximum | 48.3% | 100.0% |
| Range | 43.7% | 98.4% |
| Mean | 20.4% | 47.1% |
| Median | 18.6% | 42.7% |
| Interquartile 25% (IQ1) | 15.5% | 21.4% |
| Interquartile 75% (IQ3) | 23.2% | 68.7% |
| Interquartile Range (IQR) | 7.7% | 47.3% |
| Standard Deviation (Sample) | 9.1% | 29.9% |
| Standard Deviation (Population) | 9.1% | 29.2% |
Similar Demographics by Single Father Poverty
Demographics Similar to Guatemalans by Single Father Poverty
In terms of single father poverty, the demographic groups most similar to Guatemalans are Arab (16.6%, a difference of 0.0%), European (16.6%, a difference of 0.030%), New Zealander (16.6%, a difference of 0.070%), Eastern European (16.6%, a difference of 0.070%), and Immigrants from Senegal (16.6%, a difference of 0.080%).
| Demographics | Rating | Rank | Single Father Poverty |
| Immigrants | North America | 15.1 /100 | #203 | Poor 16.6% |
| Immigrants | Guatemala | 14.8 /100 | #204 | Poor 16.6% |
| Venezuelans | 14.3 /100 | #205 | Poor 16.6% |
| Immigrants | Senegal | 13.7 /100 | #206 | Poor 16.6% |
| New Zealanders | 13.7 /100 | #207 | Poor 16.6% |
| Eastern Europeans | 13.7 /100 | #208 | Poor 16.6% |
| Europeans | 13.2 /100 | #209 | Poor 16.6% |
| Guatemalans | 12.9 /100 | #210 | Poor 16.6% |
| Arabs | 12.8 /100 | #211 | Poor 16.6% |
| Immigrants | Southern Europe | 11.2 /100 | #212 | Poor 16.7% |
| Ghanaians | 11.0 /100 | #213 | Poor 16.7% |
| Spanish | 10.7 /100 | #214 | Poor 16.7% |
| Immigrants | Scotland | 9.6 /100 | #215 | Tragic 16.7% |
| Immigrants | England | 9.5 /100 | #216 | Tragic 16.7% |
| Cheyenne | 9.3 /100 | #217 | Tragic 16.7% |
Demographics Similar to Paiute by Single Father Poverty
In terms of single father poverty, the demographic groups most similar to Paiute are Central American Indian (21.7%, a difference of 0.27%), Colville (21.4%, a difference of 1.3%), Tohono O'odham (22.0%, a difference of 1.8%), Pueblo (21.1%, a difference of 2.4%), and Native/Alaskan (22.4%, a difference of 3.5%).
| Demographics | Rating | Rank | Single Father Poverty |
| Pennsylvania Germans | 0.0 /100 | #323 | Tragic 20.0% |
| Americans | 0.0 /100 | #324 | Tragic 20.1% |
| Blacks/African Americans | 0.0 /100 | #325 | Tragic 20.4% |
| Immigrants | Yemen | 0.0 /100 | #326 | Tragic 20.6% |
| Choctaw | 0.0 /100 | #327 | Tragic 20.7% |
| Pueblo | 0.0 /100 | #328 | Tragic 21.1% |
| Colville | 0.0 /100 | #329 | Tragic 21.4% |
| Paiute | 0.0 /100 | #330 | Tragic 21.6% |
| Central American Indians | 0.0 /100 | #331 | Tragic 21.7% |
| Tohono O'odham | 0.0 /100 | #332 | Tragic 22.0% |
| Natives/Alaskans | 0.0 /100 | #333 | Tragic 22.4% |
| Kiowa | 0.0 /100 | #334 | Tragic 22.5% |
| Shoshone | 0.0 /100 | #335 | Tragic 22.9% |
| Cajuns | 0.0 /100 | #336 | Tragic 23.1% |
| Sioux | 0.0 /100 | #337 | Tragic 23.9% |