Colville vs Immigrants from Greece Single Father Poverty
COMPARE
Colville
Immigrants from Greece
Single Father Poverty
Single Father Poverty Comparison
Colville
Immigrants from Greece
21.4%
SINGLE FATHER POVERTY
0.0/ 100
METRIC RATING
329th/ 347
METRIC RANK
16.7%
SINGLE FATHER POVERTY
8.1/ 100
METRIC RATING
221st/ 347
METRIC RANK
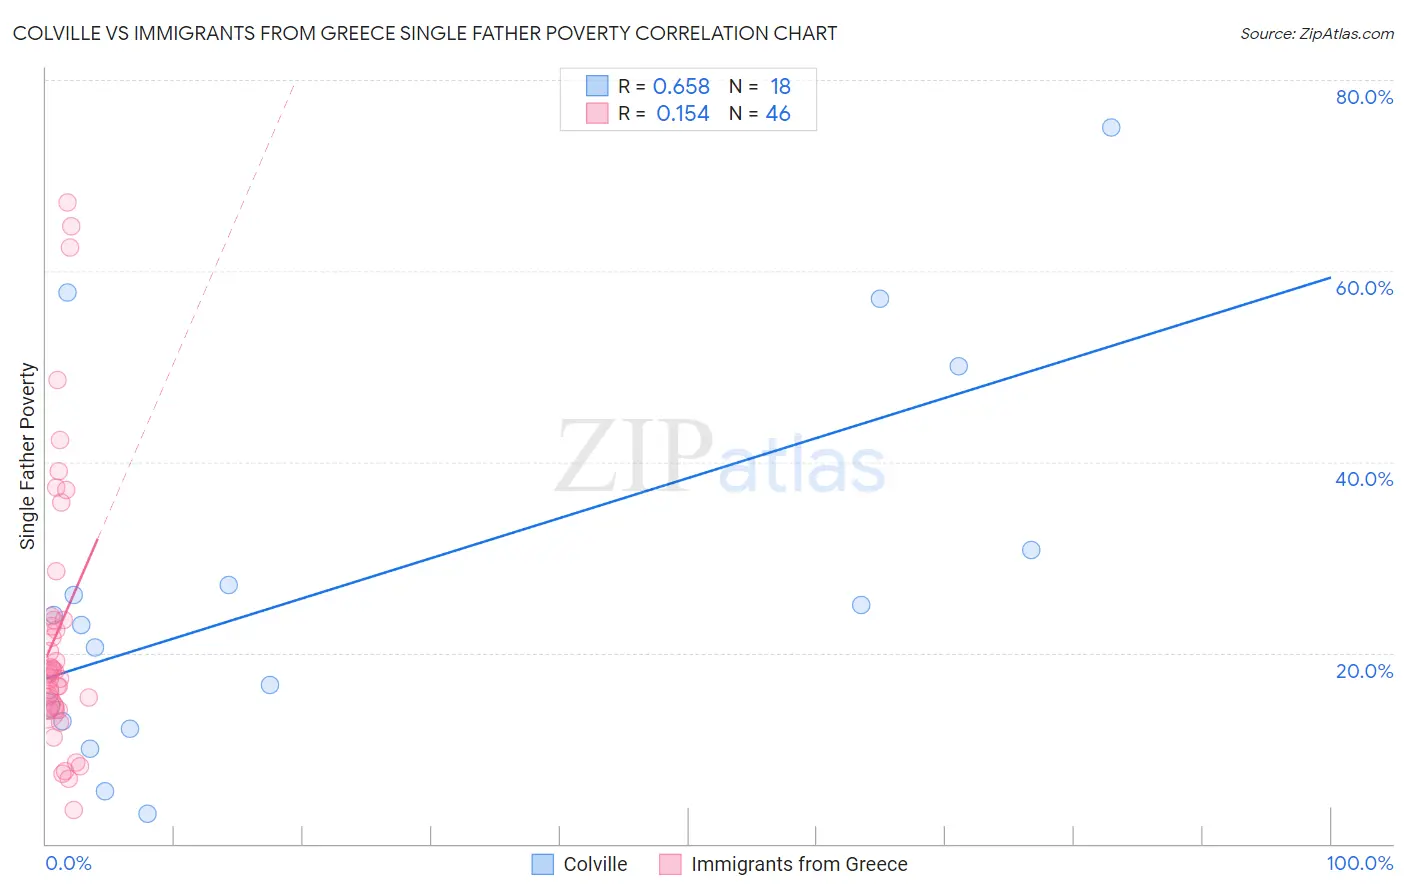
Colville vs Immigrants from Greece Single Father Poverty Correlation Chart
The statistical analysis conducted on geographies consisting of 32,657,120 people shows a significant positive correlation between the proportion of Colville and poverty level among single fathers in the United States with a correlation coefficient (R) of 0.658 and weighted average of 21.4%. Similarly, the statistical analysis conducted on geographies consisting of 176,789,916 people shows a poor positive correlation between the proportion of Immigrants from Greece and poverty level among single fathers in the United States with a correlation coefficient (R) of 0.154 and weighted average of 16.7%, a difference of 27.6%.
Single Father Poverty Correlation Summary
| Measurement | Colville | Immigrants from Greece |
| Minimum | 3.1% | 3.6% |
| Maximum | 75.0% | 67.2% |
| Range | 71.9% | 63.7% |
| Mean | 27.3% | 22.4% |
| Median | 23.4% | 18.0% |
| Interquartile 25% (IQ1) | 12.8% | 14.1% |
| Interquartile 75% (IQ3) | 30.8% | 23.4% |
| Interquartile Range (IQR) | 18.0% | 9.4% |
| Standard Deviation (Sample) | 20.0% | 14.8% |
| Standard Deviation (Population) | 19.4% | 14.7% |
Similar Demographics by Single Father Poverty
Demographics Similar to Colville by Single Father Poverty
In terms of single father poverty, the demographic groups most similar to Colville are Pueblo (21.1%, a difference of 1.1%), Paiute (21.6%, a difference of 1.3%), Central American Indian (21.7%, a difference of 1.5%), Choctaw (20.7%, a difference of 3.0%), and Tohono O'odham (22.0%, a difference of 3.1%).
| Demographics | Rating | Rank | Single Father Poverty |
| Creek | 0.0 /100 | #322 | Tragic 19.8% |
| Pennsylvania Germans | 0.0 /100 | #323 | Tragic 20.0% |
| Americans | 0.0 /100 | #324 | Tragic 20.1% |
| Blacks/African Americans | 0.0 /100 | #325 | Tragic 20.4% |
| Immigrants | Yemen | 0.0 /100 | #326 | Tragic 20.6% |
| Choctaw | 0.0 /100 | #327 | Tragic 20.7% |
| Pueblo | 0.0 /100 | #328 | Tragic 21.1% |
| Colville | 0.0 /100 | #329 | Tragic 21.4% |
| Paiute | 0.0 /100 | #330 | Tragic 21.6% |
| Central American Indians | 0.0 /100 | #331 | Tragic 21.7% |
| Tohono O'odham | 0.0 /100 | #332 | Tragic 22.0% |
| Natives/Alaskans | 0.0 /100 | #333 | Tragic 22.4% |
| Kiowa | 0.0 /100 | #334 | Tragic 22.5% |
| Shoshone | 0.0 /100 | #335 | Tragic 22.9% |
| Cajuns | 0.0 /100 | #336 | Tragic 23.1% |
Demographics Similar to Immigrants from Greece by Single Father Poverty
In terms of single father poverty, the demographic groups most similar to Immigrants from Greece are Immigrants from Denmark (16.7%, a difference of 0.0%), Immigrants from Ghana (16.7%, a difference of 0.010%), Immigrants from Spain (16.7%, a difference of 0.010%), Immigrants from Uganda (16.7%, a difference of 0.070%), and Cheyenne (16.7%, a difference of 0.17%).
| Demographics | Rating | Rank | Single Father Poverty |
| Spanish | 10.7 /100 | #214 | Poor 16.7% |
| Immigrants | Scotland | 9.6 /100 | #215 | Tragic 16.7% |
| Immigrants | England | 9.5 /100 | #216 | Tragic 16.7% |
| Cheyenne | 9.3 /100 | #217 | Tragic 16.7% |
| Immigrants | Uganda | 8.6 /100 | #218 | Tragic 16.7% |
| Immigrants | Ghana | 8.1 /100 | #219 | Tragic 16.7% |
| Immigrants | Denmark | 8.1 /100 | #220 | Tragic 16.7% |
| Immigrants | Greece | 8.1 /100 | #221 | Tragic 16.7% |
| Immigrants | Spain | 8.0 /100 | #222 | Tragic 16.7% |
| Immigrants | Austria | 7.0 /100 | #223 | Tragic 16.8% |
| Immigrants | Norway | 6.5 /100 | #224 | Tragic 16.8% |
| Menominee | 6.4 /100 | #225 | Tragic 16.8% |
| Hispanics or Latinos | 6.1 /100 | #226 | Tragic 16.8% |
| British | 5.6 /100 | #227 | Tragic 16.8% |
| Belgians | 5.3 /100 | #228 | Tragic 16.8% |