Argentinean vs Cape Verdean Single Male Poverty
COMPARE
Argentinean
Cape Verdean
Single Male Poverty
Single Male Poverty Comparison
Argentineans
Cape Verdeans
11.9%
SINGLE MALE POVERTY
99.5/ 100
METRIC RATING
73rd/ 347
METRIC RANK
13.8%
SINGLE MALE POVERTY
0.2/ 100
METRIC RATING
263rd/ 347
METRIC RANK
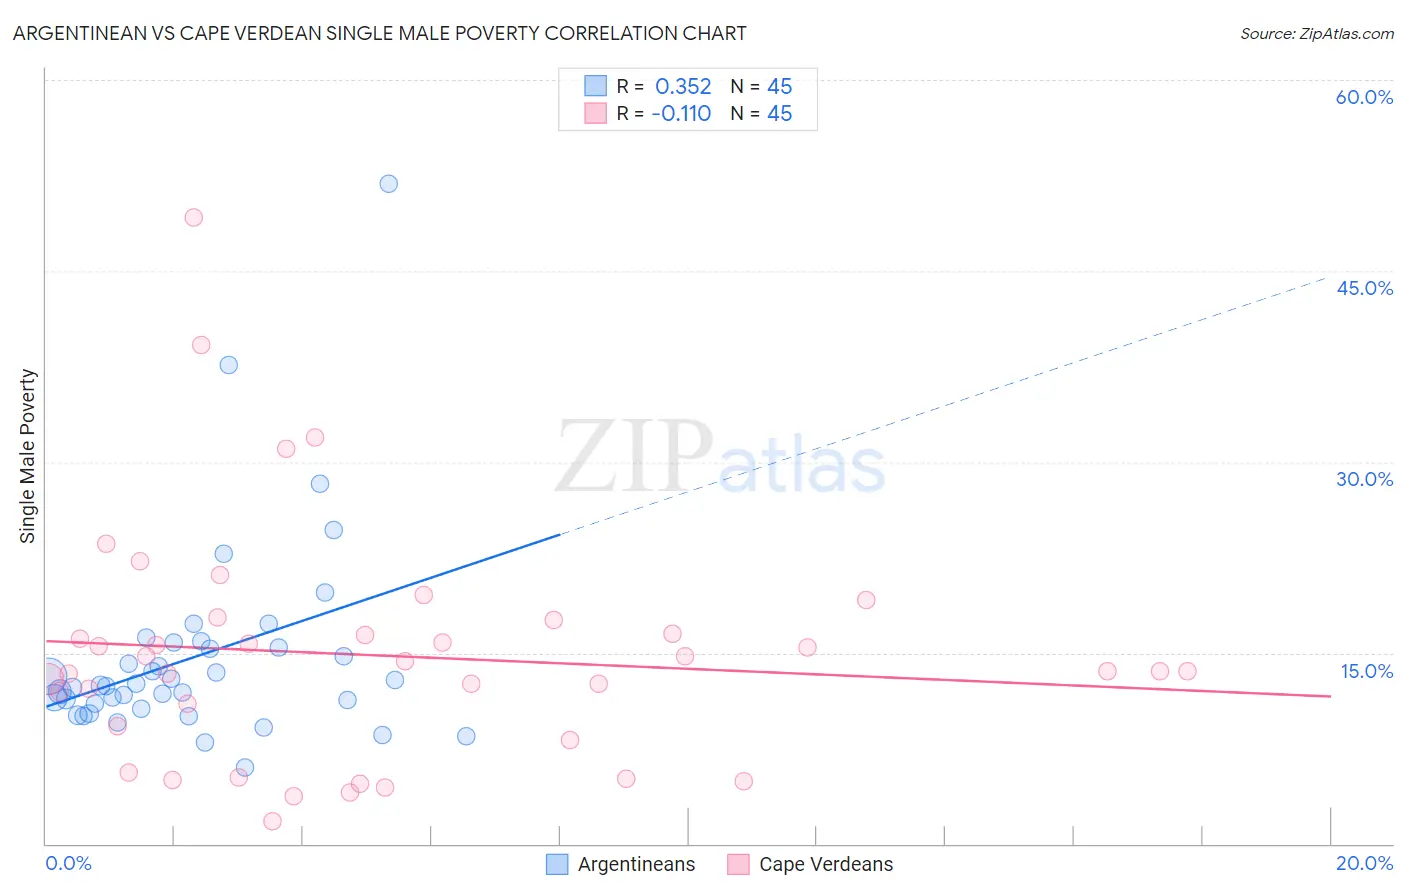
Argentinean vs Cape Verdean Single Male Poverty Correlation Chart
The statistical analysis conducted on geographies consisting of 268,813,546 people shows a mild positive correlation between the proportion of Argentineans and poverty level among single males in the United States with a correlation coefficient (R) of 0.352 and weighted average of 11.9%. Similarly, the statistical analysis conducted on geographies consisting of 101,894,910 people shows a poor negative correlation between the proportion of Cape Verdeans and poverty level among single males in the United States with a correlation coefficient (R) of -0.110 and weighted average of 13.8%, a difference of 16.0%.
Single Male Poverty Correlation Summary
| Measurement | Argentinean | Cape Verdean |
| Minimum | 6.0% | 1.7% |
| Maximum | 51.8% | 49.2% |
| Range | 45.8% | 47.5% |
| Mean | 14.7% | 14.8% |
| Median | 12.4% | 13.6% |
| Interquartile 25% (IQ1) | 10.8% | 8.7% |
| Interquartile 75% (IQ3) | 15.6% | 17.1% |
| Interquartile Range (IQR) | 4.8% | 8.4% |
| Standard Deviation (Sample) | 7.9% | 9.3% |
| Standard Deviation (Population) | 7.9% | 9.2% |
Similar Demographics by Single Male Poverty
Demographics Similar to Argentineans by Single Male Poverty
In terms of single male poverty, the demographic groups most similar to Argentineans are Chilean (11.9%, a difference of 0.060%), Immigrants from Argentina (11.9%, a difference of 0.13%), Uruguayan (11.9%, a difference of 0.25%), Immigrants from Northern Africa (11.9%, a difference of 0.27%), and Immigrants from Greece (11.9%, a difference of 0.31%).
| Demographics | Rating | Rank | Single Male Poverty |
| Immigrants | Uruguay | 99.6 /100 | #66 | Exceptional 11.9% |
| Immigrants | Ukraine | 99.6 /100 | #67 | Exceptional 11.9% |
| Immigrants | Croatia | 99.6 /100 | #68 | Exceptional 11.9% |
| Immigrants | Russia | 99.6 /100 | #69 | Exceptional 11.9% |
| Immigrants | Nepal | 99.6 /100 | #70 | Exceptional 11.9% |
| Immigrants | Greece | 99.6 /100 | #71 | Exceptional 11.9% |
| Immigrants | Argentina | 99.5 /100 | #72 | Exceptional 11.9% |
| Argentineans | 99.5 /100 | #73 | Exceptional 11.9% |
| Chileans | 99.5 /100 | #74 | Exceptional 11.9% |
| Uruguayans | 99.4 /100 | #75 | Exceptional 11.9% |
| Immigrants | Northern Africa | 99.4 /100 | #76 | Exceptional 11.9% |
| Immigrants | Malaysia | 99.2 /100 | #77 | Exceptional 12.0% |
| Immigrants | Venezuela | 99.1 /100 | #78 | Exceptional 12.0% |
| Immigrants | Belgium | 99.0 /100 | #79 | Exceptional 12.0% |
| Armenians | 98.7 /100 | #80 | Exceptional 12.1% |
Demographics Similar to Cape Verdeans by Single Male Poverty
In terms of single male poverty, the demographic groups most similar to Cape Verdeans are Fijian (13.8%, a difference of 0.12%), West Indian (13.8%, a difference of 0.19%), Hungarian (13.8%, a difference of 0.29%), Swiss (13.8%, a difference of 0.34%), and Immigrants from Congo (13.9%, a difference of 0.35%).
| Demographics | Rating | Rank | Single Male Poverty |
| Immigrants | Belize | 0.4 /100 | #256 | Tragic 13.7% |
| Immigrants | Central America | 0.3 /100 | #257 | Tragic 13.8% |
| Immigrants | Guatemala | 0.3 /100 | #258 | Tragic 13.8% |
| Guatemalans | 0.3 /100 | #259 | Tragic 13.8% |
| Swiss | 0.3 /100 | #260 | Tragic 13.8% |
| Hungarians | 0.3 /100 | #261 | Tragic 13.8% |
| Fijians | 0.3 /100 | #262 | Tragic 13.8% |
| Cape Verdeans | 0.2 /100 | #263 | Tragic 13.8% |
| West Indians | 0.2 /100 | #264 | Tragic 13.8% |
| Immigrants | Congo | 0.2 /100 | #265 | Tragic 13.9% |
| Immigrants | Cabo Verde | 0.1 /100 | #266 | Tragic 13.9% |
| Germans | 0.1 /100 | #267 | Tragic 13.9% |
| Immigrants | Mexico | 0.1 /100 | #268 | Tragic 13.9% |
| Scottish | 0.1 /100 | #269 | Tragic 14.0% |
| Immigrants | Saudi Arabia | 0.1 /100 | #270 | Tragic 14.0% |