Delaware vs Cape Verdean Single Male Poverty
COMPARE
Delaware
Cape Verdean
Single Male Poverty
Single Male Poverty Comparison
Delaware
Cape Verdeans
15.0%
SINGLE MALE POVERTY
0.0/ 100
METRIC RATING
299th/ 347
METRIC RANK
13.8%
SINGLE MALE POVERTY
0.2/ 100
METRIC RATING
263rd/ 347
METRIC RANK
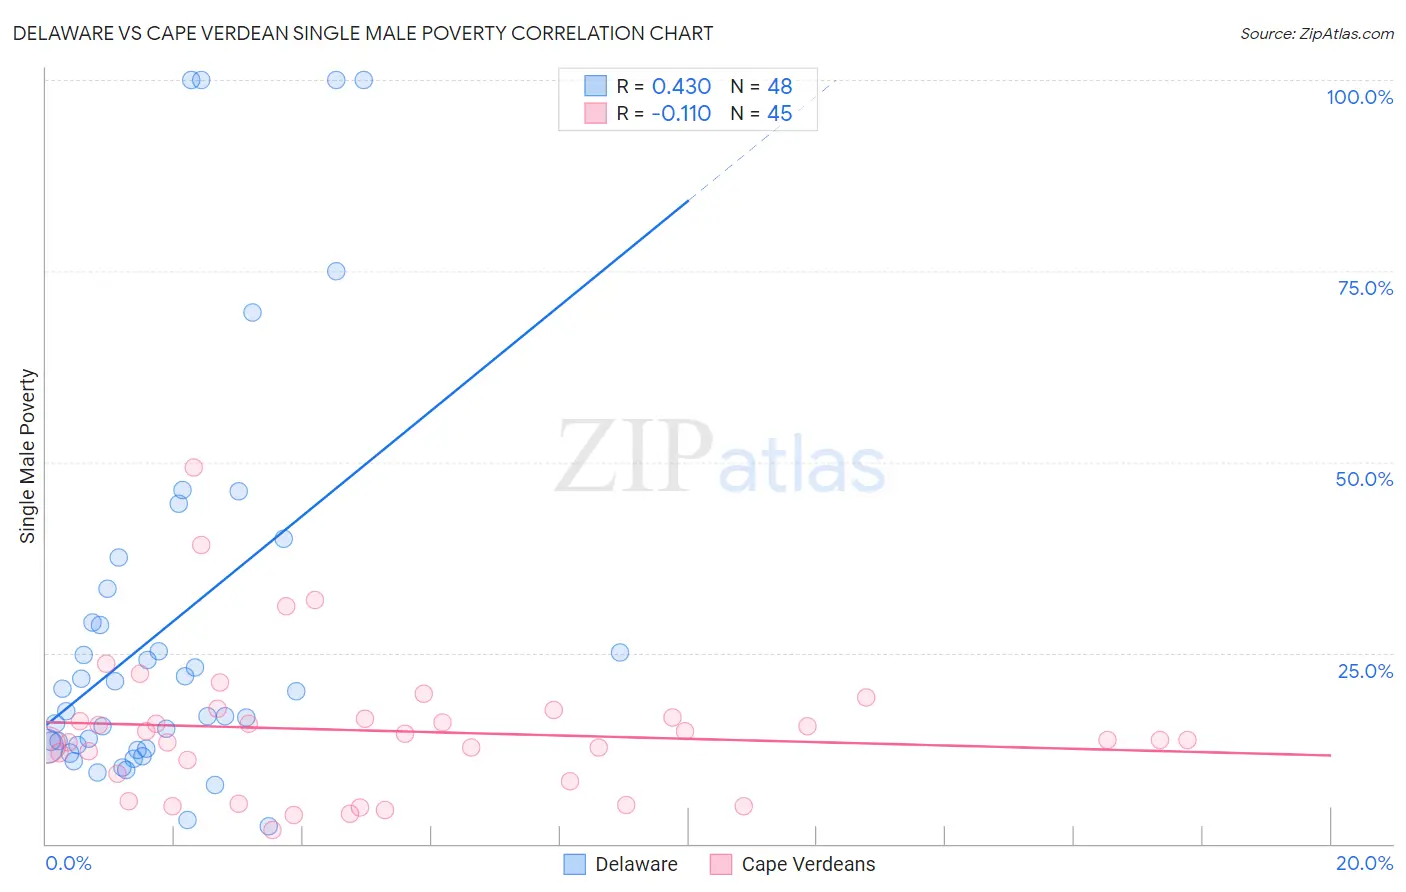
Delaware vs Cape Verdean Single Male Poverty Correlation Chart
The statistical analysis conducted on geographies consisting of 90,922,782 people shows a moderate positive correlation between the proportion of Delaware and poverty level among single males in the United States with a correlation coefficient (R) of 0.430 and weighted average of 15.0%. Similarly, the statistical analysis conducted on geographies consisting of 101,894,910 people shows a poor negative correlation between the proportion of Cape Verdeans and poverty level among single males in the United States with a correlation coefficient (R) of -0.110 and weighted average of 13.8%, a difference of 8.7%.
Single Male Poverty Correlation Summary
| Measurement | Delaware | Cape Verdean |
| Minimum | 2.4% | 1.7% |
| Maximum | 100.0% | 49.2% |
| Range | 97.6% | 47.5% |
| Mean | 28.5% | 14.8% |
| Median | 18.7% | 13.6% |
| Interquartile 25% (IQ1) | 12.6% | 8.7% |
| Interquartile 75% (IQ3) | 31.1% | 17.1% |
| Interquartile Range (IQR) | 18.5% | 8.4% |
| Standard Deviation (Sample) | 26.3% | 9.3% |
| Standard Deviation (Population) | 26.0% | 9.2% |
Similar Demographics by Single Male Poverty
Demographics Similar to Delaware by Single Male Poverty
In terms of single male poverty, the demographic groups most similar to Delaware are French American Indian (15.0%, a difference of 0.39%), Cree (15.1%, a difference of 0.45%), Dominican (15.2%, a difference of 1.3%), Alsatian (15.2%, a difference of 1.4%), and Immigrants from Dominican Republic (14.8%, a difference of 1.7%).
| Demographics | Rating | Rank | Single Male Poverty |
| Immigrants | Nonimmigrants | 0.0 /100 | #292 | Tragic 14.6% |
| French Canadians | 0.0 /100 | #293 | Tragic 14.6% |
| Ottawa | 0.0 /100 | #294 | Tragic 14.6% |
| Scotch-Irish | 0.0 /100 | #295 | Tragic 14.7% |
| Africans | 0.0 /100 | #296 | Tragic 14.7% |
| Immigrants | Dominican Republic | 0.0 /100 | #297 | Tragic 14.8% |
| French American Indians | 0.0 /100 | #298 | Tragic 15.0% |
| Delaware | 0.0 /100 | #299 | Tragic 15.0% |
| Cree | 0.0 /100 | #300 | Tragic 15.1% |
| Dominicans | 0.0 /100 | #301 | Tragic 15.2% |
| Alsatians | 0.0 /100 | #302 | Tragic 15.2% |
| Aleuts | 0.0 /100 | #303 | Tragic 15.4% |
| Alaska Natives | 0.0 /100 | #304 | Tragic 15.4% |
| Blackfeet | 0.0 /100 | #305 | Tragic 15.5% |
| Pennsylvania Germans | 0.0 /100 | #306 | Tragic 15.6% |
Demographics Similar to Cape Verdeans by Single Male Poverty
In terms of single male poverty, the demographic groups most similar to Cape Verdeans are Fijian (13.8%, a difference of 0.12%), West Indian (13.8%, a difference of 0.19%), Hungarian (13.8%, a difference of 0.29%), Swiss (13.8%, a difference of 0.34%), and Immigrants from Congo (13.9%, a difference of 0.35%).
| Demographics | Rating | Rank | Single Male Poverty |
| Immigrants | Belize | 0.4 /100 | #256 | Tragic 13.7% |
| Immigrants | Central America | 0.3 /100 | #257 | Tragic 13.8% |
| Immigrants | Guatemala | 0.3 /100 | #258 | Tragic 13.8% |
| Guatemalans | 0.3 /100 | #259 | Tragic 13.8% |
| Swiss | 0.3 /100 | #260 | Tragic 13.8% |
| Hungarians | 0.3 /100 | #261 | Tragic 13.8% |
| Fijians | 0.3 /100 | #262 | Tragic 13.8% |
| Cape Verdeans | 0.2 /100 | #263 | Tragic 13.8% |
| West Indians | 0.2 /100 | #264 | Tragic 13.8% |
| Immigrants | Congo | 0.2 /100 | #265 | Tragic 13.9% |
| Immigrants | Cabo Verde | 0.1 /100 | #266 | Tragic 13.9% |
| Germans | 0.1 /100 | #267 | Tragic 13.9% |
| Immigrants | Mexico | 0.1 /100 | #268 | Tragic 13.9% |
| Scottish | 0.1 /100 | #269 | Tragic 14.0% |
| Immigrants | Saudi Arabia | 0.1 /100 | #270 | Tragic 14.0% |