Choctaw vs Russian Single Father Poverty
COMPARE
Choctaw
Russian
Single Father Poverty
Single Father Poverty Comparison
Choctaw
Russians
20.7%
SINGLE FATHER POVERTY
0.0/ 100
METRIC RATING
327th/ 347
METRIC RANK
16.4%
SINGLE FATHER POVERTY
30.1/ 100
METRIC RATING
188th/ 347
METRIC RANK
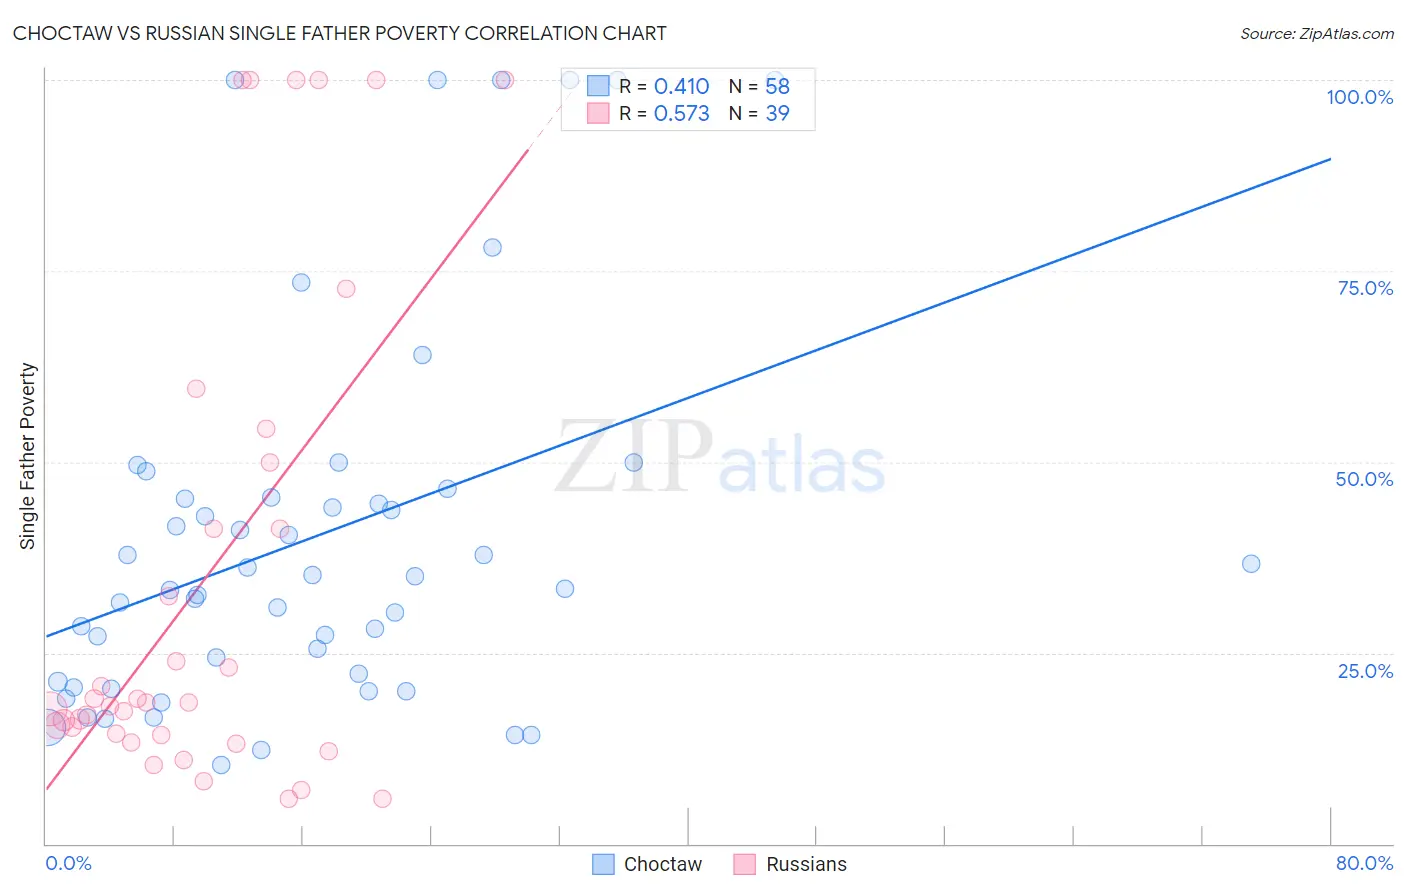
Choctaw vs Russian Single Father Poverty Correlation Chart
The statistical analysis conducted on geographies consisting of 228,054,527 people shows a moderate positive correlation between the proportion of Choctaw and poverty level among single fathers in the United States with a correlation coefficient (R) of 0.410 and weighted average of 20.7%. Similarly, the statistical analysis conducted on geographies consisting of 378,661,966 people shows a substantial positive correlation between the proportion of Russians and poverty level among single fathers in the United States with a correlation coefficient (R) of 0.573 and weighted average of 16.4%, a difference of 26.0%.
Single Father Poverty Correlation Summary
| Measurement | Choctaw | Russian |
| Minimum | 10.3% | 5.9% |
| Maximum | 100.0% | 100.0% |
| Range | 89.7% | 94.1% |
| Mean | 40.2% | 34.4% |
| Median | 34.2% | 18.4% |
| Interquartile 25% (IQ1) | 21.2% | 14.2% |
| Interquartile 75% (IQ3) | 45.3% | 50.0% |
| Interquartile Range (IQR) | 24.1% | 35.8% |
| Standard Deviation (Sample) | 24.9% | 32.0% |
| Standard Deviation (Population) | 24.7% | 31.6% |
Similar Demographics by Single Father Poverty
Demographics Similar to Choctaw by Single Father Poverty
In terms of single father poverty, the demographic groups most similar to Choctaw are Immigrants from Yemen (20.6%, a difference of 0.69%), Black/African American (20.4%, a difference of 1.7%), Pueblo (21.1%, a difference of 1.9%), Colville (21.4%, a difference of 3.0%), and American (20.1%, a difference of 3.3%).
| Demographics | Rating | Rank | Single Father Poverty |
| Inupiat | 0.0 /100 | #320 | Tragic 19.5% |
| Cherokee | 0.0 /100 | #321 | Tragic 19.6% |
| Creek | 0.0 /100 | #322 | Tragic 19.8% |
| Pennsylvania Germans | 0.0 /100 | #323 | Tragic 20.0% |
| Americans | 0.0 /100 | #324 | Tragic 20.1% |
| Blacks/African Americans | 0.0 /100 | #325 | Tragic 20.4% |
| Immigrants | Yemen | 0.0 /100 | #326 | Tragic 20.6% |
| Choctaw | 0.0 /100 | #327 | Tragic 20.7% |
| Pueblo | 0.0 /100 | #328 | Tragic 21.1% |
| Colville | 0.0 /100 | #329 | Tragic 21.4% |
| Paiute | 0.0 /100 | #330 | Tragic 21.6% |
| Central American Indians | 0.0 /100 | #331 | Tragic 21.7% |
| Tohono O'odham | 0.0 /100 | #332 | Tragic 22.0% |
| Natives/Alaskans | 0.0 /100 | #333 | Tragic 22.4% |
| Kiowa | 0.0 /100 | #334 | Tragic 22.5% |
Demographics Similar to Russians by Single Father Poverty
In terms of single father poverty, the demographic groups most similar to Russians are Ukrainian (16.4%, a difference of 0.020%), Immigrants from Venezuela (16.4%, a difference of 0.050%), Latvian (16.5%, a difference of 0.060%), Immigrants from Burma/Myanmar (16.5%, a difference of 0.11%), and Immigrants from Guyana (16.5%, a difference of 0.16%).
| Demographics | Rating | Rank | Single Father Poverty |
| Immigrants | Western Africa | 36.0 /100 | #181 | Fair 16.4% |
| Immigrants | Italy | 35.7 /100 | #182 | Fair 16.4% |
| Aleuts | 35.3 /100 | #183 | Fair 16.4% |
| Cambodians | 34.6 /100 | #184 | Fair 16.4% |
| Panamanians | 33.6 /100 | #185 | Fair 16.4% |
| Immigrants | Venezuela | 31.0 /100 | #186 | Fair 16.4% |
| Ukrainians | 30.4 /100 | #187 | Fair 16.4% |
| Russians | 30.1 /100 | #188 | Fair 16.4% |
| Latvians | 28.9 /100 | #189 | Fair 16.5% |
| Immigrants | Burma/Myanmar | 28.0 /100 | #190 | Fair 16.5% |
| Immigrants | Guyana | 27.1 /100 | #191 | Fair 16.5% |
| Immigrants | Switzerland | 24.8 /100 | #192 | Fair 16.5% |
| Ecuadorians | 24.5 /100 | #193 | Fair 16.5% |
| Cape Verdeans | 24.4 /100 | #194 | Fair 16.5% |
| Immigrants | Barbados | 24.3 /100 | #195 | Fair 16.5% |